The pricing section describes the graphs that you can create to help you price properties.
When going to the "Pricing" area,
you will notice three key changes on the screen.
These changes will be described in more detail below.
- Changes to the Ribbon, which provide additional functionality specific to the "Pricing" area.
- The MLS Data Sheet, which is a one-line description of data exported from the MLS.
- The "folder" tabs near the bottom of the screen reflects the "Pricing" area.
This first section will walk you through how to create a Scattergram and some of the additional
features you may consider when making a Scattergram.
The next sections will go into more detail about the various features associated with creating a
Scattergram.
Scattergrams are a great pricing tool.
When we price properties, we like to look at five key factors:
Homes that have recently sold in the same location as the subject property,
price of the homes that have sold recently,
the size of those homes,
the special features and their condition.
You can summarize all five of those factors on one Scattergram at one time,
allowing them to be a very effective visual pricing tool.
 I want to
view
how to price using a Scattergram.
I want to
view
how to price using a Scattergram.
Creating a Scattergram
This first section will walk you through how to create a Scattergram.
When you select the "Pricing" button,
the pricing screen will be shown.
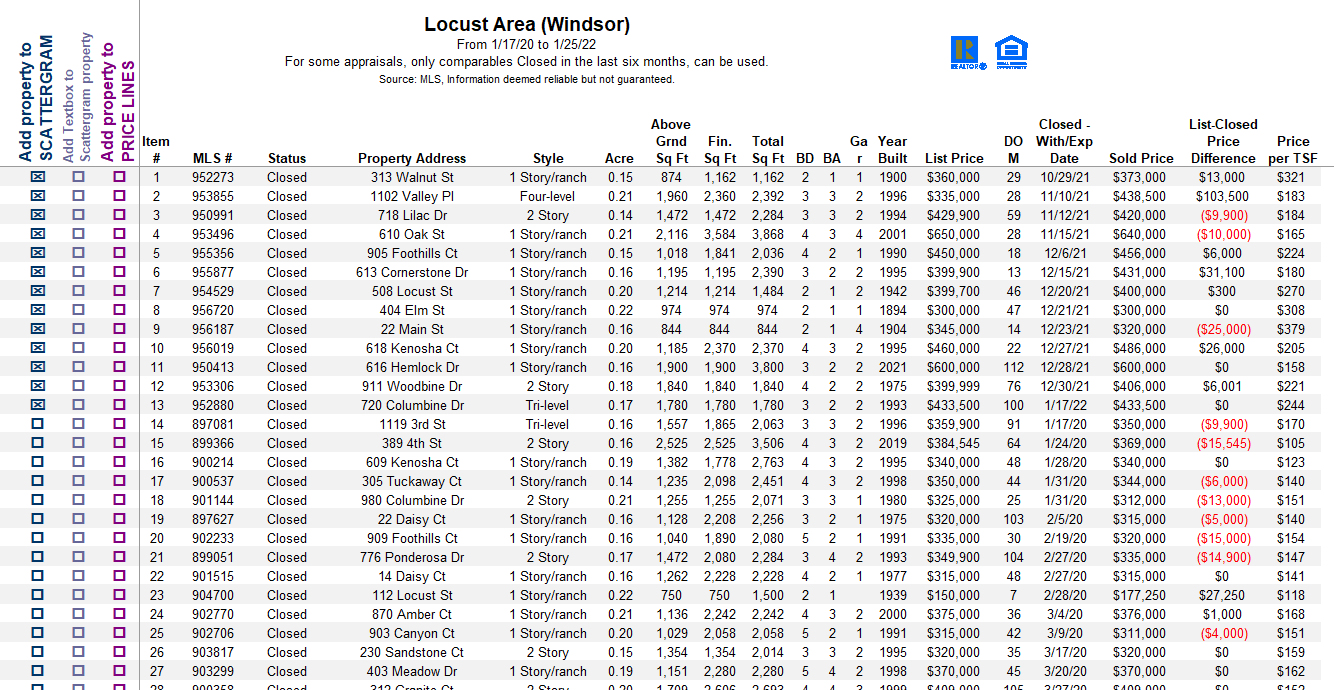
The first thing you will notice is that there is a list of all the properties that you have
exported.
This sheet containing the list of properties is the "MLS Data Form".
The list is a one-line description that contains the MLS number, the address,
and other characteristics of the property.
The actual properties that are listed are limited to the last two years of data (as of the start of the
year).
Any data older than the last two years is truncated.
If you want to include older data,
you need to set the
Mulit-Year Buying Pattern
option.
The first step to creating a Scattergram is selecting the data that you want on your graph.
When you first see the "MLS Data Form",
you will find that several properties are already selected.
You can identify selected properties by the checkbox under the columns at the left.
Those properties that are selected
are initially selected by the Focus 1st Pricing system when it creates the
Real Estate Review.
The selected properties are the most recent data.
While looking at the most recent data is something you would want to do,
there are additional criteria you may wish to use to determine how to select properties.
You may decide that you want only to include properties with the same architectural style (2 Story, 1 Story,
Tri-Level...).
One feature that will help group properties with the same characteristics is that if you
double-click
at the top of any header,
and the data will be sorted based on that header.
Double-click
the header again,
and the data will be reverse sorted.
You are also able to
double-click
and sort the data based
on
double-clicking
the column header on the selected properties.
The first time you do this, all the selected properties may move to the bottom of the list.
Just
double-click
again to bring all the properties back up.
To choose properties to include on your graph, you must first select that property.
You can see selected properties
by the checked box under the appropriate column.
There are three columns on the left side:
- Add properties to Scattergram
- Add Text Box to Scattergram property
- Add property to Pricelines
When you've selected a property under the "Add properties to Scattergram" column, that property will be
added to the Scattergram.
There are several ways to "select" properties.
Here is a summary of the ways to select properties under any of the columns:
- Left-click the box under the appropriate column.
Then press the
Select Property
button located in the ribbon.
That box will show as selected.
- Drag the left mouse across several boxes (boxes you want to select).
Then press the
Select Property
button located in the ribbon.
Those boxes will show as selected.
- Right-Click the box under the appropriate column.
When you right-click any box, it will toggle that box.
(If it is not selected, it will check the box, showing it is now "selected".
If selected, it will uncheck the box, showing it is now "unselected".)
- Drag the left mouse across several boxes (the boxes you want to select).
Then right-click in those boxes.
The selection in the boxes will toggle.
- Left-click on an address (or drag your mouse across several addresses).
Then you can press the
Select Property
button located in the
ribbon,
or you can right-click (which again will toggle the checkbox) to select.
Notice that, in this case, you will select the checkboxes under
ALL the
columns.
-
You can also select properties using the selection tool.
You can find this tool by using the
Create Graph Options
button.
Once you select the properties you want on your Scattergram,
you are ready to create your Scattergram.
To create your Scattergram select the
Create Graph Options
button.
Once you do that, you will see the "Create Graph Options" dialog box.
Then select the
Create Graph
button.
Then you will see the "Create Scattergram" dialog box.

In the dialog box, there are three key areas.
The "Select Scattergram Options" area, the "Fields to Include" area, and then the show trend/value options.
Here is a short description and some key points to consider.
-
Select Scattergram Options.
This area is where you select the x-axis you want to graph.
The choices depend on your MLS and the export file you are reading.
If your MLS doesn't support all the square footage, then some choices may not be
available.
If you export (for example) land,
then the only option that may be available would be acres.
If any choices are unavailable, that choice will be 'greyed' out.
-
Fields to Include.
In this area, you can select fields to include when adding text boxes to the data points.
To add a text box to the data point,
you need to have the box checked under the "Add Textbox to Scattergram" column.
To select a field to add, select the checkbox.
The fields you select will populate in all the text boxes that you've chosen to add to the
Scattergram.
Of course, you could choose to add all the fields.
However, the Scattergram will look more cluttered and more complex.
We find that the best Scattergram are easy to understand.
The Item Number field isn't an MLS field (all other fields are).
The numbering scheme corresponds to that shown on the "MLS Data Form".
Be aware that if you re-sort the "MLS Data Form" data, the number may no longer
match this number.
So if you do create a Scattergram with the "Item Number",
then be sure to print out the MLS Data form that correlates to the Graph you selected.
-
Show Trend/Value optons. These are the last two
options that you can use.
The "Show Trend line" will show the trend line, also called the "Fair Market Value" line.
This line shows the trend of the sold homes.
The Show Value Boxes are a couple of text boxes you can add to the Scattergram. These boxes show,
where properties that are closer to the value box have the additional square footage for the price
compared to others,
and where properties have the less square footage for the price than others.
Once you select the options you prefer, select the
Create Scattergram Graph
button,
and your Scattergram will be created for you.
If you already have an existing Scattergram, you will receive a message asking if you would like to
replace the
existing (most recently created) Scattergram or keep them both.
If you decide to replace it,
then the most recently created Scattergram will be replaced with the current one.
If you decide to "Keep them Both",
then a new Scattergram will be created and added to the group of graphs.
Once you create the Scattergram,
you will see it on the screen.
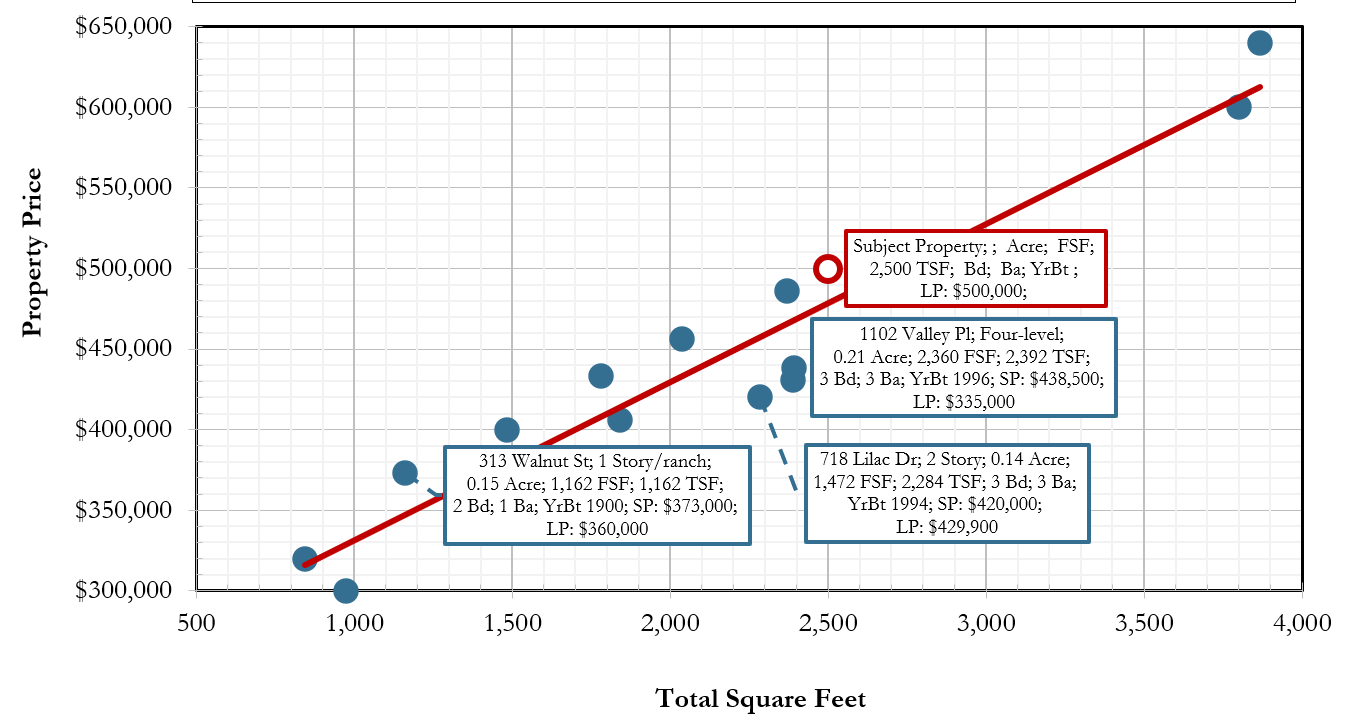
The Graph below is an example of a Scattergram.

There are cases where selected properties have
the "size" of the property to graph, set to 0.
If this is the case, then that property will not be graphed.
If you want to have this property on the graph,
then you can either change the "size" (x-axis) that you are graphing,
or you can edit the spreadsheet directly and enter the size in the appropriate column.
Adding Text Boxes to your Scattergram
Scattergrams are a great pricing tool.
They become much more effective when you are adding in textboxes that summarize the characteristics
of specific properties.
We recommend that you do add textboxes to properties that are comparable in size,
and in some cases, you may want to add text boxes to "outliers".
"Outliers" are properties located away from the trend line.
In most cases, these properties may not be comparable in one of the
five factors
that we use
to compare properties.
To add text boxes to the Scattergram,
you need to
select the box
under the "Add Textbox to Scattergram" column.
Once you've selected the boxes that you want to add text boxes to,
you
create your Scattergram
just as you did before.
This time when you create your Scattergram,
be sure to
select the fields
that you want to populate in your text boxes.
Each of the data points which you've chosen to include text boxes will now show
text boxes, and those text boxes will contain fields with the data you chose to populate.
Each selected data point will have a text box to the right of the data point.
Since that is the case,
in many cases, you will want to "move" the textbox.
To move the text box, select the textbox first and then drag your mouse while keeping
your mouse on the textbox boundary.
To select the textbox,
first, select the text box.
After the first time you "select" the text box,
you will notice that all text boxes are "highlighted."
You can see this because you will see small circles on the corners of the text boxes.
Select the textbox of interest again,
and you will see that only that textbox is "highlighted."
Now that it is selected, place your cursor on the edge of the text box (stay away from the corners),
and drag your mouse,
You will see your textbox move with the cursor.
A "leader line" is created as you move further from the data point.
This may take a little practice before you get the feel.
Moving textboxes is something you will want to do quite frequently.
Be sure to stay away from the corners.
When you drag the corners, you will change the shape of the textbox, and things may not work
as you expect them to after that.
Now that you have your Scattergram with textboxes,
you are also able to "modify" the information in those text boxes.
To edit the text boxes,
you can "select" the text box and then position the cursor within the text,
of where you want to edit.
We recommend you "add" text to state the subject property's key differentiators.
For example, if one of the properties had "Granite Counters and Hardwood Flooring," you can add that in
the appropriate textbox.
We recommend using abbreviations when possible to save space in the text box.
Ribbon Changes
When you select the "Pricing" button,
the "Focus 1st Pricing" ribbon changes to reflect additional functionality in the "Pricing" function.
Here is a screen shot of the updated ribbon .
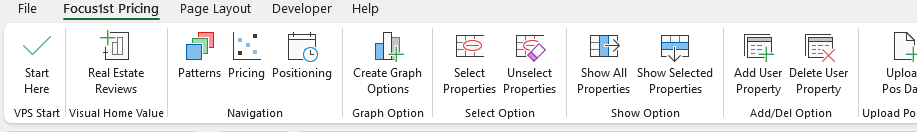
The Focus 1st Ribbon has additional buttons used for the Pricing function.
Here is a list of those buttons and their Pricing function.

The
Create Graph Options
button is used
start creating graph options.
This is the function that is used to clear data, select properties, and then create
Scattegram and priceline graphs.
Once you select this button,
you will see additional functions for both the
Scattergram and Priceline.
-
Scattergram Options.
The functions on the left side of
the dialog box affect the Scattergram.
-
Clear Data.
This function will clear all the data
under the "Add Property to Scattegram" column.
-
Select Data.
This function is used to select data.
When you select this button, the "Scattergram Filter" dialog box will pop up.
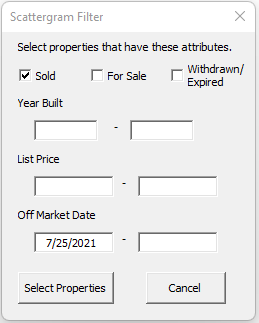
You can use this box to have properties selected for you based on the
filter that you set.
The default is to select all the sold properties that have sold within the last six
months.
You can make selections of all status items
(selecting properties For Sale will also select properties Under Contract).
You can also filter on the "Year Built",
the "List Price", and by changing the "Off Market Date".
Once you have completed your selection,
select the
Select Properties
button.
Any data that meet the filter requirements will be selected and sorted to the top
of the
"MLS Data Form".
-
Create Graph Options.
This function
creates the Scattergram graph using the selected properties as data.
The "Create Scattergram" dialog box will pop up when you select this option.
There are several selections that you can use to customize the Scattergram that you
will create.
For a more detailed discussion, see the
creating a Scattergram section.
- Priceline Options. The functions on the right side of the dialog box affect the
Priceline.
-
Clear Data.
This function will clear all the data
under the "Add Property to Priceline" column.
-
Select Data.
The "Priceline Filter" dialog box will pop up when you select this button.
-
Create Graph Options.
This function
creates the Priceline graph using the selected properties as data.
For additional information on Pricelines, see the Competitive Price Lines
section.
The
Select Properties
button is used
to "select" properties.
You will need to select properties under the appropriate column to add properties to either the
Scattergram
or Priceline graph
or textboxes to the Scattergram graph.
When a property is selected, you will see
a "checked" box in the appropriate row under that column.
You can also drag your mouse over several boxes,
and using the
Select Properties
button,
you will select all the boxes at once.
This button works along with the
UnSelect Properties
button.
You can also select boxes,
by dragging your mouse over the "addresses" and then using the
Select Properties
button.
This action will select all the boxes under all the columns.
The
UnSelect Properties
button is used
to unselect properties that are selected.
When a property is selected, you will see
a "checked" box in the appropriate row under that column.
To unselect a property,
choose the box you want to unselect
and press the
UnSelect Property
button.
You can also drag your mouse over several boxes,
and the
UnSelect Properties
button,
you will unselect all the boxes at once.
This button works along with the
Select Properties
button.
The
Show All Properties
button is used
show all the properties that you've exported.
This is used in conjuction with the
Show Selected Properties
function.
If you've limited your view to the properties that you have selected and you want to
now view all properties,
this button will "undo" the
Show Selected Properties
action.
The
Show Selected Properties
button is used
to show only the properties you have selected on the "MLS Data Form".
Any selected property under any of the columns will "show".
This function allows you to remove properties that are not necessary from your view.
Additionally, we also calculate the average of several of the fields.
Here is an example.

Once you limit your view to only the "selected" properties,
you can always go back to view "all" properties by using the
Show All Properties
button.

The
Add User Property
button is used
add user properties to the "MLS Data Form".
Adding properties to the "MLS Data Form" is necessary to be able to add those
properties to the Scattergram or Priceline.
When you press the
Add User Property
button
you will see the following dialog box.
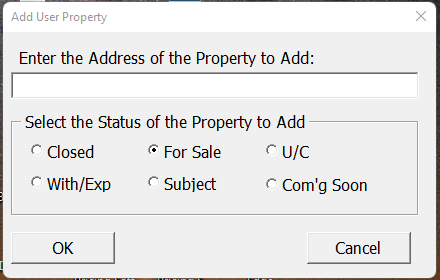
From here, you can identify the property address you want to add
(or you can identify the property as "subject").
Additionally, you identify the status of the property that you are adding.
When adding a user property,
there are a couple of additional status options.
The first is the "Coming Soon" option.
This option is to take advantage of the newly used status in several MLS options.
The is also the "Subject" option.
This unique status option helps you identify the "subject" property.
We have several features regarding the "Subject" property and deal with it in the
Subject Property section.
Once you add the property to the "MLS Data form" you can edit the information in the row
to add in the characteristics of that property.

Edit the information directly in the spreadsheet to complete adding the user property.
To identify user-added properties, unique MLS numbers are used.
Do not delete or change this number.
This feature works along with the
Delete User Property
function.
The
Delete User Property
button is used
delete user-added properties.
To use this function,
select the user-added property you want to delete and then press this button.
You are only able to delete properties that you added.
This feature works along with the
Add User Property
function.
Subject Property
This section discusses the concept of the "Subject Property".
We treat the Subject Property in a unique way so that
you can highlight the customers' property on various graphs.
There are several ways to "add" subject properties to your data.
Once you add a subject property to your data,
you can then add it to your graphs.
The first way you can "add" a subject property is by using the
Add User Property
feature.
Set the added property's "Status" to "Subject" to identify it as the "Subject" property.
The "Subject" property is treated differently than other properties.
Once you've added a Subject property,
you can edit the row to fill in the characteristics of that property.
There should only ever be one Subject property at a time.
You may get inconsistent results if you have more than one Subject property at a time.
You can also "Change" an existing property to be a Subject property by
overwriting the status and changing it to "Subject".
You may want to do this to identify a property that is already listed and For Sale,
and that you want to highlight for the customer.
Like other properties, you can add the Subject property to a Scattergram (and Priceline).
While each property that you place on a Scattergram has a color and look based on its status,
the subject property is placed on a graph as an open circle, as shown below.
To place the Subject property on the graph,
you would need to make sure that there is a square footage
(the type of square footage that you chose to graph),
and a price associated with the Subject property.
There are times when you may not want to identify a price for the subject property.
These are time when
you are working with the customer to determine that price.
If you leave the price blank, a vertical dashed line will be created at the property size.
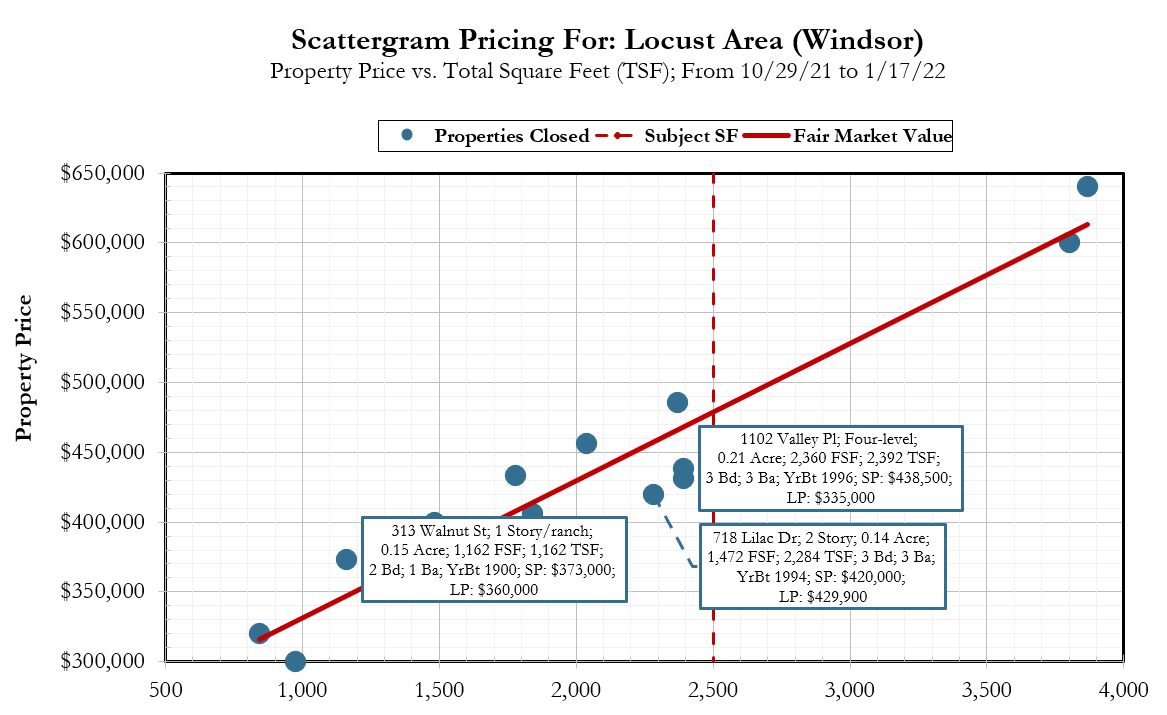
You could also add a text box to show information about the subject property.
Competitive Price Lines
Competitive Price Lines (also referred to as Pricelines)
is a great tool for summarizing all the Real Estate activity in a period.
Generally, a Priceline would be created for an area or neighborhood.
Pricelines consists of three sets of bar graph.
The set of bars at the top show the sold price of properties that have Closed.
The set of bars in the middle show the list price of properties that are For Sale and that are Under
Contract.
The bottom set of bars show the price of properties that have Withdrawn or Expired.
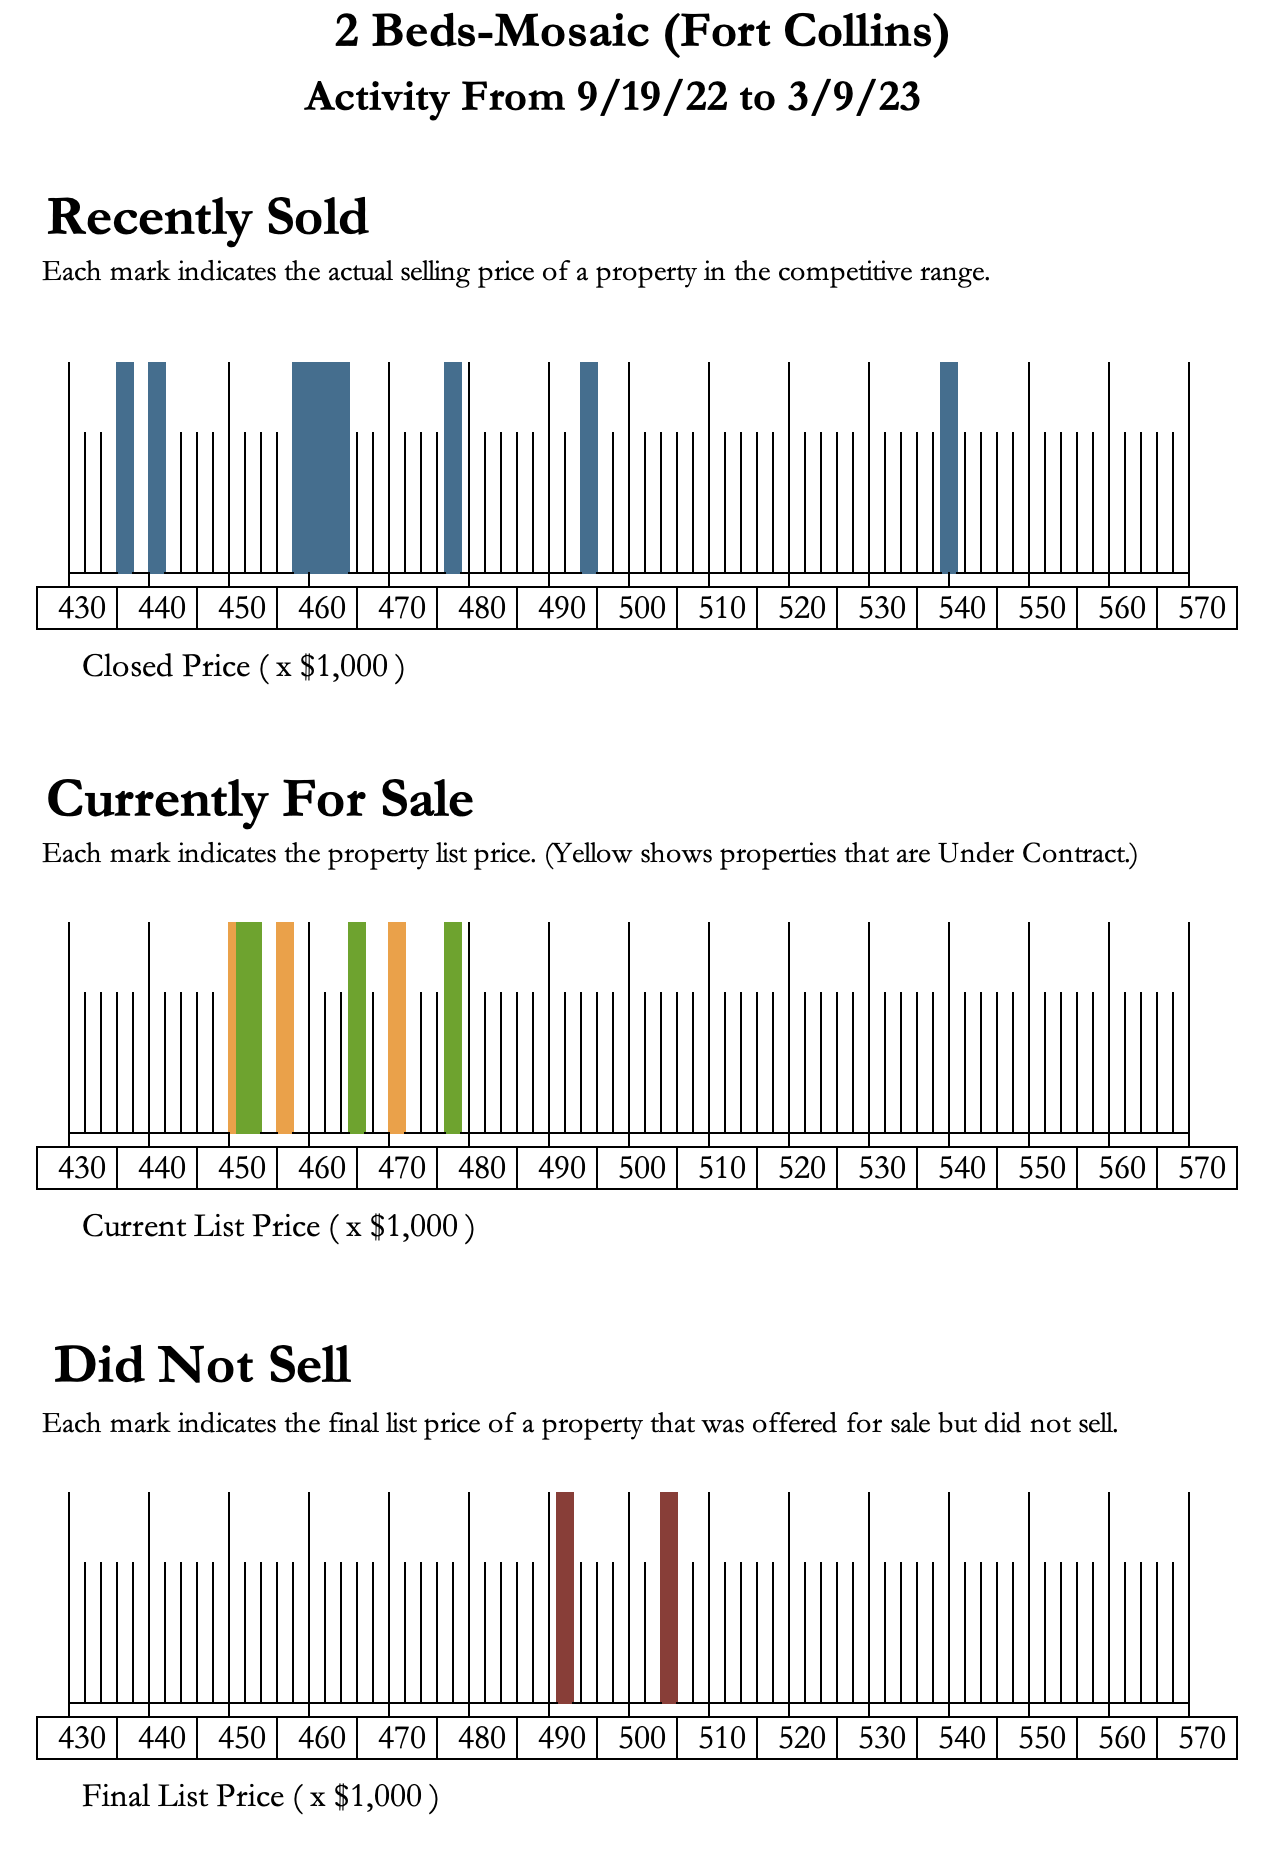
Pricelines are great tools for condominiums, townhouses, and can also be used for single family homes.
When using Pricelines,
you need to make sure that you consider your data and select proper data for your Pricelines.
Pricelines works best for properties that match.
In the example above,
we seleted data for only two bedroom properties.
The Priceline selection tool combined with the MLS Data sheet can help you select
the best data for your Priceline.
Let's walk through how to use those tools to choose data for your Priceline.
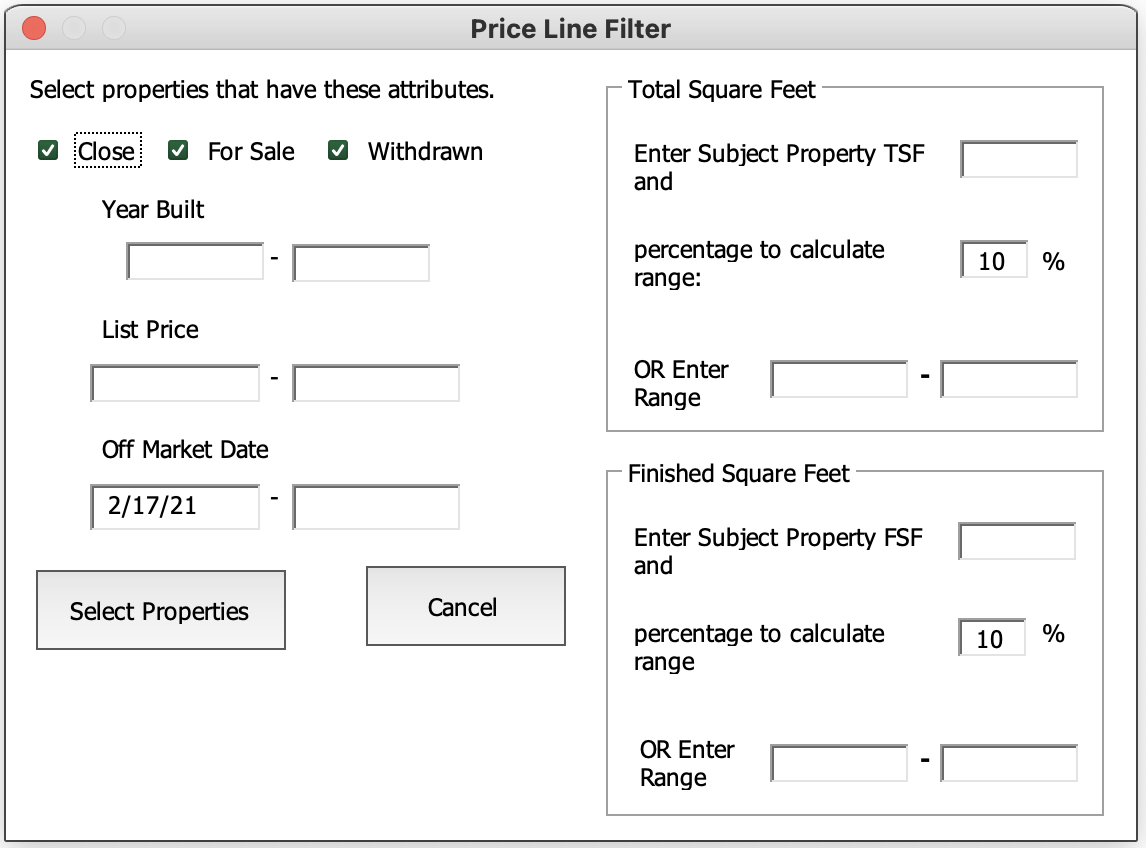
The first step in selecting data is to use the Price Line Filter.
To access the Price Line Filter,
select the Graph Options button in the Focus
1st ribbon.
Once you select this option,
the Graphing Options dialog box is displayed.
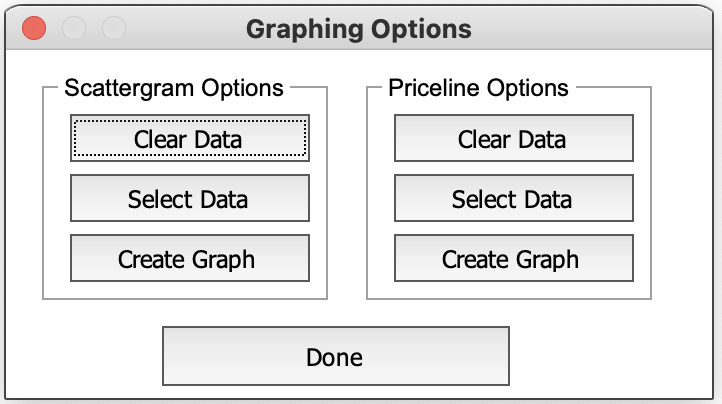
As you can see,
the Graphic Options dialog box has two sections,
the Scattergram Options section and the
Priceline Options section.
We will be using the Priceline Options section.
The Priceline Options section has three buttons.
The Select Data button is used to identify the criteria to select data to
be
placed on your Priceline.
The default is to select all status activity over the last six months.
You can go further back in time to select additional data.
Here is an example of the Price Line Filter.
For the "Mosaic" example,
we don't need to make any changes.
We can just select the Select Properties button.
All the Real Estate activity from the date shown, will be selected.
Leaving the "second date" empty in the "Off Market Date" area, will default to today's date.
All data that meets the criteria identified in the Priceline Filter will be selected.
You can see the properties that are selected by the checkmark under the
Add Property to Price Lines column in the
MLS Data Form.
You can then make additional changes to your selection.
In this example, we are interested in two bedroom properties.
So we can sort the properties in our list based on the number of bedrooms.
Double-clicking on any header will sort the data based on the header you clicked on.
For this example, we double-clicked on the Bedrooms header.
This sorts our data based on the number of bedrooms.
Once we've sorted, we can easily Unselect properties that are not two
bedrooms.
When we have all the properties selected that we want on our Priceline,
we can the create the graph by using the Graph Options button and then
the Create Graph button in the Priceline
Options area.
Using Pricelines with Single Family Homes
Pricelines can also be used effectively with single family homes as well.
When doing Pricelines with single family homes, we need to be a little more precise in selecting the data.
While we need to consider using data that has the same number of levels (or architectural style),
year built, etc.
we also need to consider the size of the properties.
We want to limit properties that we select to homes that are comparable in size.
Homes that are comparable in size are homes that are within 5-7% in size compared to the subject property.
Since in many cases, it may be difficult to find enough homes in this range,
you may want to go to within 10% of the subject property.
The Priceline Filter selection tool that is very helpful in
identifying properties within a specific size range.
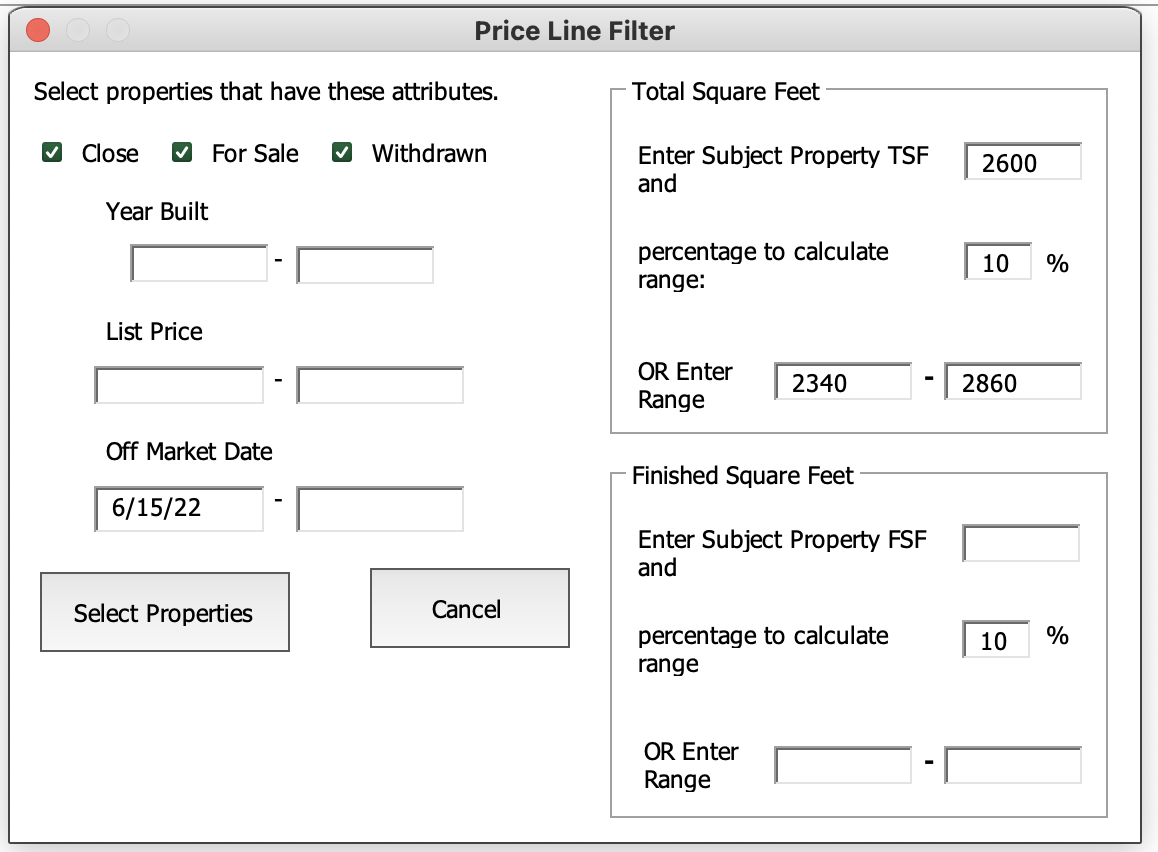
In this example, we are assuming the subject property is 2600 total square feet.
We enter that value in the Total Square Feet box.
The 10% values are automatically calculated for you.
The range identifies the minimum and maximum sizes that will be selected for your Pricelines.
If you'd like to change the percentage, you can do so.
Once you do that, you will see that the range is automatically updated.
You can override any range by just placing a value in that range.
The range that you provide will be the range used in your selection criteria.
We also provide a Finished Square Feet area,
where you can provide a size range based on Finished Square Feet.
You would generally provide either a Total Square Feet or a Finished Square Feet
range.
Providing range requirements for both Total Square Feet and Finished Square Feet
may limit the number of properties on your Priceline.
A Priceline for the example of a single family neighborhood is shown below.

For more instructions on how to run the Focus 1st software, be sure to check out our YouTube channel by
selecting this link: