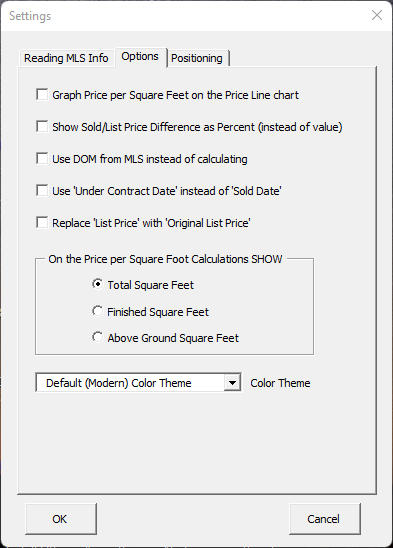
Reading MLS Info - Configuration Items

- Read in New Configuration File...
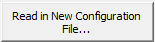
This option will allow you to read a new configuration file.
The "Read in New Configuration File" option is generally not something you would need to do.
There are cases where minor changes need to be made because of:
changes made in your MLS;
or new features provided by your MLS.
In these cases, you probably have been in touch with Focus 1st Pricing Support (support@focus1st.com).
Focus 1st support may request that you re-install the Focus 1st Pricing system
or that you read in a new configuration file.
Select this button to read a new configuration file.
The most up-to-date configuration file is available in your "file box".
You "file box" can be found in your Focus 1st Pricing account area.
To access the "file box",
First go to the
www.focus1st.com website and
select the
Login option.
Then enter your username (email address) and password.
Your "file box" is under your name
on the upper right side of the "Welcome" screen.
Select the dropdown next to your name and then select the
My
Filebox
option.
Once your "file box" opens,
you will see files that are available to you and the
download file
option.
The configuration file is called "MlsConfig.csv".
Download that file and save it in a location that you can find.
The file you downloaded is the file you will read in when using the
Read in New Configuration File... option.

This option will enable you to Reset your MLS choice.
When using the Focus 1st Pricing application,
you select your MLS to read in your export.
You may select the "keep using the same MLS" checkbox as part of that process.
The "keep using the same MLS" checkbox allows you to
continue to read in export files from this specific MLS without
providing the MLS choice for each file you read.
However, if you decide to read in a file from a different MLS later,
this option will allow you to re-enter your MLS choice when reading in your export file.
This option is advantageous if you are using two (or more) different MLS's,
(which I do at times).
Usually, I will set the "Keep using the same MLS" option each time and then
"Reset" the MLS choice when I change MLS'.
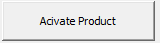
This option will allow you to "activate" the product by entering your activation code.
To obtain your activation,
go to the www.focus1st.com and
select the Login option.
Then enter your username (email address) and password.
Once you log in,
your activation code,
is in Step #2,
located on the Welcome screen.
- Replace Logo and Customize Footers
This option will allow you to add a Logo and customize each graph's footer.
Select this option to identify a "logo" file to add to each graph.
The "logo" needs to be in a graphic format.
The logo is added in the upper left when each graph is created.
To add a footer, select the "add Footer" option.
Logos are re-sized on the graphs.
Be aware that the logo you select should not be huge.
Look for a file in the 25K size range, not over 100K.
While the logo is re-sized on each graph,
if it is large, it will still retain its original storage size, making the overall file huge.
- Change the Year shown in the Graphs
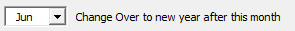
The "change over" option allows you to change over to the following year's data
at the end of the specified month.
For example, in the Odds of Selling,
you may see 2021 and 2022's data (along with the last 12 months).
At the beginning of 2023,
we will continue to show 2021 and 2022 data.
At the beginning of the 2023 year,
it may not make sense to show 2022 and 2023 data.
There just is enough data for that year.
Sometime during the year, it probably does make sense.
We start to show the following year's data once we reach the end of the month shown here.
The default is June.
After the end of June (in 2023, in our example),
we will start showing 2022 and 2023 data.
You can change that date when we show the new years data by
changing the month in this option.
Changing this option will affect the "Odds of Selling" graph,
and the years that are shown in the Time to Sell
and Buying Patterns graphs.
- Merging Duplicate Listings

Real Estate professionals may withdraw a listing out of
the MLs and then add it back in.
Doing this will reset the days on the market.
(not the cumulative days on the market),
making the listing look like a new listing.
Is is not unusual to see listings removed from the market and added back with a price adjustment.
While the MLS shows this as a "New" listing,
you may not have Focus 1st Pricing handle this listing as a new listing.
The Duplicate Listing Interval option allows you to combine two MLS sheets
that have the same address.
When the original listing has been withdrawn (or expired) from the MLS, and a new
listing is added to the MLS within a defined period,
the program will merge the new listing with the original MLS listing.
That defined period is the number of days that you enter.
For example, if you entered the value of '5', all listings removed from the market and re-entered within
five days or less
will be merged with the original listing.
When merging data by using the Duplicate Listing interval, you will find that
there will be fewer withdrawn and expired properties showing on the Odds of Selling chart.
This result occurs from the duplicate listings that are removed from the data
and merged with the previous listing.
Be aware that this will also impact the days on market values.
The days on the market are generally the off-market date (closed date, withdrawn date,
or expired date) and the List date.
For properties that are For Sale it would be the current date
minus the List date.
When merging two MLS' the days on the market is now the off-market date of the
more recent listing minus the list date of the older listing.
The updated days on the market will include the "dead" time between when the
first listing was off the market and the date the new listing was added..
- Reading data from Multiple Files

This option allows you to read multiple files.
The "Read Multi-MLS" option is for situations where you are limited to the amount of data
that you can export from your MLS.
In that case, you can export your data into multiple files.
To read in those files, set this parameter.
After reading the first file, you can
read and merge additional files.
All the files will be merged into one dataset and analyzed.
- Reading in data from Multiple MLS'

This option allows you to read files from different MLS'.
This option is useful for situations where you can find data for an area in multiple MLS'.
Listings can be added to multiple mls' when multiple MLS areas overlap.
Each time you read a file, you must provide the MLS for that file.
After reading the first file, you can
read and merge additional files.
All the files will be merged into one dataset and analyzed.
When you are using this option,
you would generally want to set the duplicate listing interval to a non-zero value to make sure
that you merge in duplicates for listings that are in both MLS'.
- Show 3, 6, and 12-Month Odds of Selling

As a default, we show the Odds of Selling for the previous year,
the most recent year, and the last 12 months.
We prefer to show the Odds of Selling for a 12-monthly interval
since this will remove the impact of any seasonal markets and
the effect they may have on the data.
However, when you are using the value positioning worksheet or
when you are doing absorption rate pricing processes,
you may want to see the "absorption rate" and "month supply"
for 3, 6, and 12-month intervals.
This option will provide that for you.
Setting this option will change the view of the Odds of Selling.
It will also change the view of the Time to Sell and Buying Pattern graphs.
The Time to Sell and Buying Pattern graph defaults to a "calendar" year view
(January through December).
This function changes
the Time to Sell and Buying Pattern to a "running" year view.
- Showing all Data / Multi-Year Buying Patterns

In most cases,
analysis that Real Estate professionals are doing,
would be done on the most recent data.
Thus, when reading the export file,
we automatically truncate data older than two years (or so).
However, when this option is selected,
we keep all the data.
Additionally, we will create a new graph that shows all the sold properties with their sold price
and their sold date.
We refer to this graph as the Multi-Year Buying Pattern.
You can find the Multi-Year Buying Pattern in the Buying Pattern section along with the other Buying
Pattern graphs.
Setting this option will add the Multi-Year Buying Pattern graph and will also include all the
data from the export file.
All data can then be viewed in the
MLS Data Form
worksheet.
Additionally, the Multi-Year Buying Pattern graph can be handy in showing how property prices
have changed over time.
When you do your search, include data over the period you want to show,
set this option, and read it in your export file.
This option makes for a great appreciation graph.
Creating an appreciation graph is excellent for condos and townhomes.
We recommend limiting your search results
to specific home sizes when using this with single-family homes.
For example, if the subject property is 2000 square feet,
then we suggest that you limit your search to homes from 1800 - 2200 square feet (plus or minus
10%).
Select this link for more information on
Multi-Year
Buying Patterns.
- Showing Median instead of Average

The "Average" price of properties sold for each period is shown on the Time to Sell graph.
If you prefer to show the "Median" sold price; instead, you can select this option.
When selecting this option, the median price replaces the average price on the Real Estate
Review as well.
- How to Treat Properties Under Contract
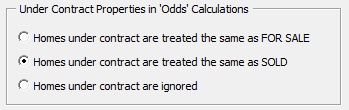
This option allows you to change how the properties that are Under Contract will impact the Odds of
Selling
calculations.
How you choose to treat Under-Contract properties may depend on your market.
One view is that homes Under Contract are still "active" and For Sale and
should be included and calculated with the properties that are For Sale.
Another view is that homes that are under contract are not available and should be
included and calculated with the Sold properties.
With the last option you can ignore these properties in the Odds calculations altogether.
Including the Under Contract properties with the properties For Sale will decrease the Odds of
Selling,
whereas including them with the Sold properties would increase the Odds of Selling.
Positioning - Configuration Items
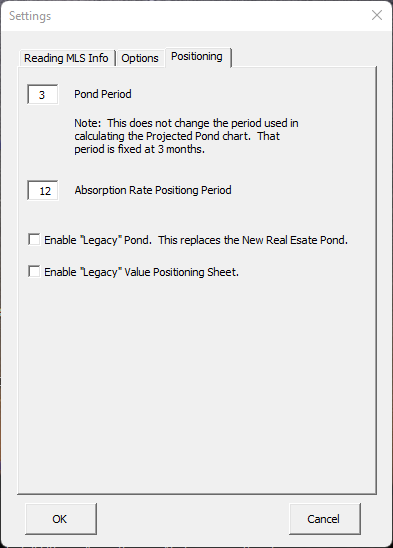
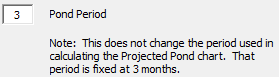
The option will change the period of the pond.
The period of the pond is the period where it summarizes the number of properties that
have come on the market in the last few months,
which is determined by the value in this option.
The default is three months.
While you can change the period (shown above) of incoming activity,
the projection is limited to the next three months.
Projections further out become less accurate.
To increase the "Projected Pond" accuracy,
be sure to include
all status activity for the last two years,
when doing your positioning search.
The "Projected Pond" is based on the market trend.
The program calculates the trend based on activity from the last two years.
- Change Period Used in the Value Positioning Sheet
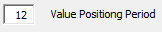
This option allows you to change the "Value Positioning" period.
The default is 12 months.
Sometimes, you may want to change the period to be less.
To see the results of this,
the "Enable 'Legacy' Value Positioning" option must be set
(which is the default case).
- Replace the Updated Pond with the Legacy Pond

Based on customer feedback,
we have updated the "Real Estate Pond" look and feel.
However, we've heard some customers still prefer the previous version.
By selecting this option, you can replace the updated pond with the previous versions.
While the newer pond is only the "Projected Pond",
when you select this option,
you get two ponds.
One is a summary of the last three months (or as defined by the Pond Period),
which includes the number of new listings over the previous three months,
and the number of properties sold in the last three months.
The second is the projected pond,
which projects the number of new listings for the next three months,
and the number of projected sold properties in the next three months.
- Add in the Value Positioning Sheet
This option will enable and add the Value Positioning Worksheet in the Positioning area (tab).
Select this link to see more information on the Value Positioning
Worksheet.
This option is, by default, turned on in many cases.
However, if it is not on, this option will ensure the "Value Positioning Worksheets" is included.