HOW TO EXPORT DATA FROM YOUR MLS
STEPS TO EXPORT DATA FROM YOUR MLS
1. Create the Custom Display by adding the required fields.
Before you can export data, you must first setup the Display format.
This is a one-time action that you will need to do.
Once you have created your Display format you will not need to do this again and you can skip this
section.
When you create your Display format, it must be setup exactly as shown in this section for the Focus 1st
application to understand the format.
To create your Display format,
select the following menu items:
- Under your profile name in upper right corner -> Settings -> Custom Displays.
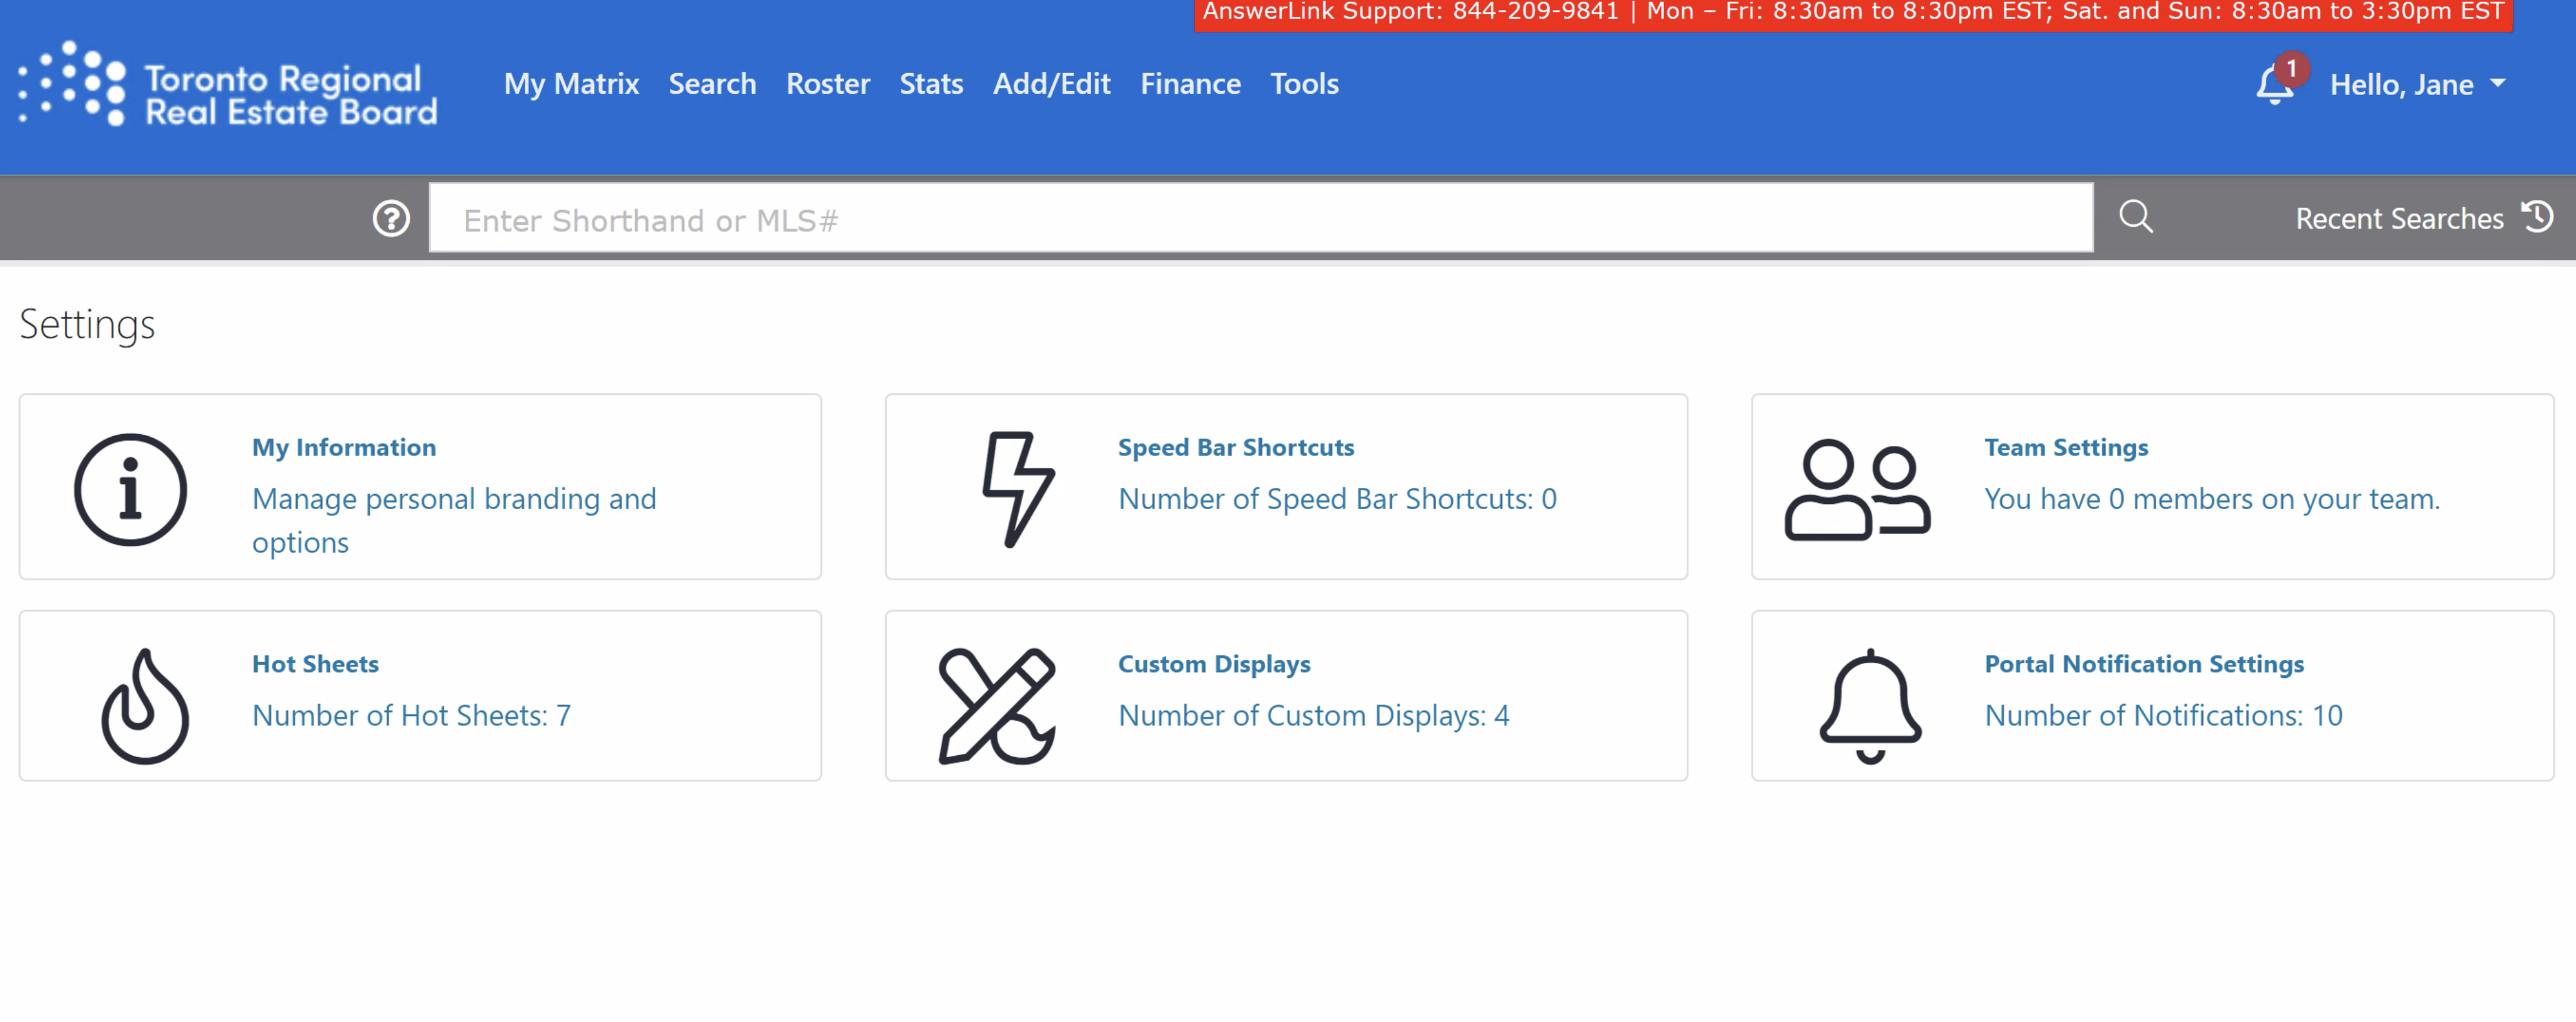 Once you've selected the Custom Displays option,
select the Add Display button.
You will then see the Build Custom Displays dialog box as shown below.
Once you've selected the Custom Displays option,
select the Add Display button.
You will then see the Build Custom Displays dialog box as shown below.
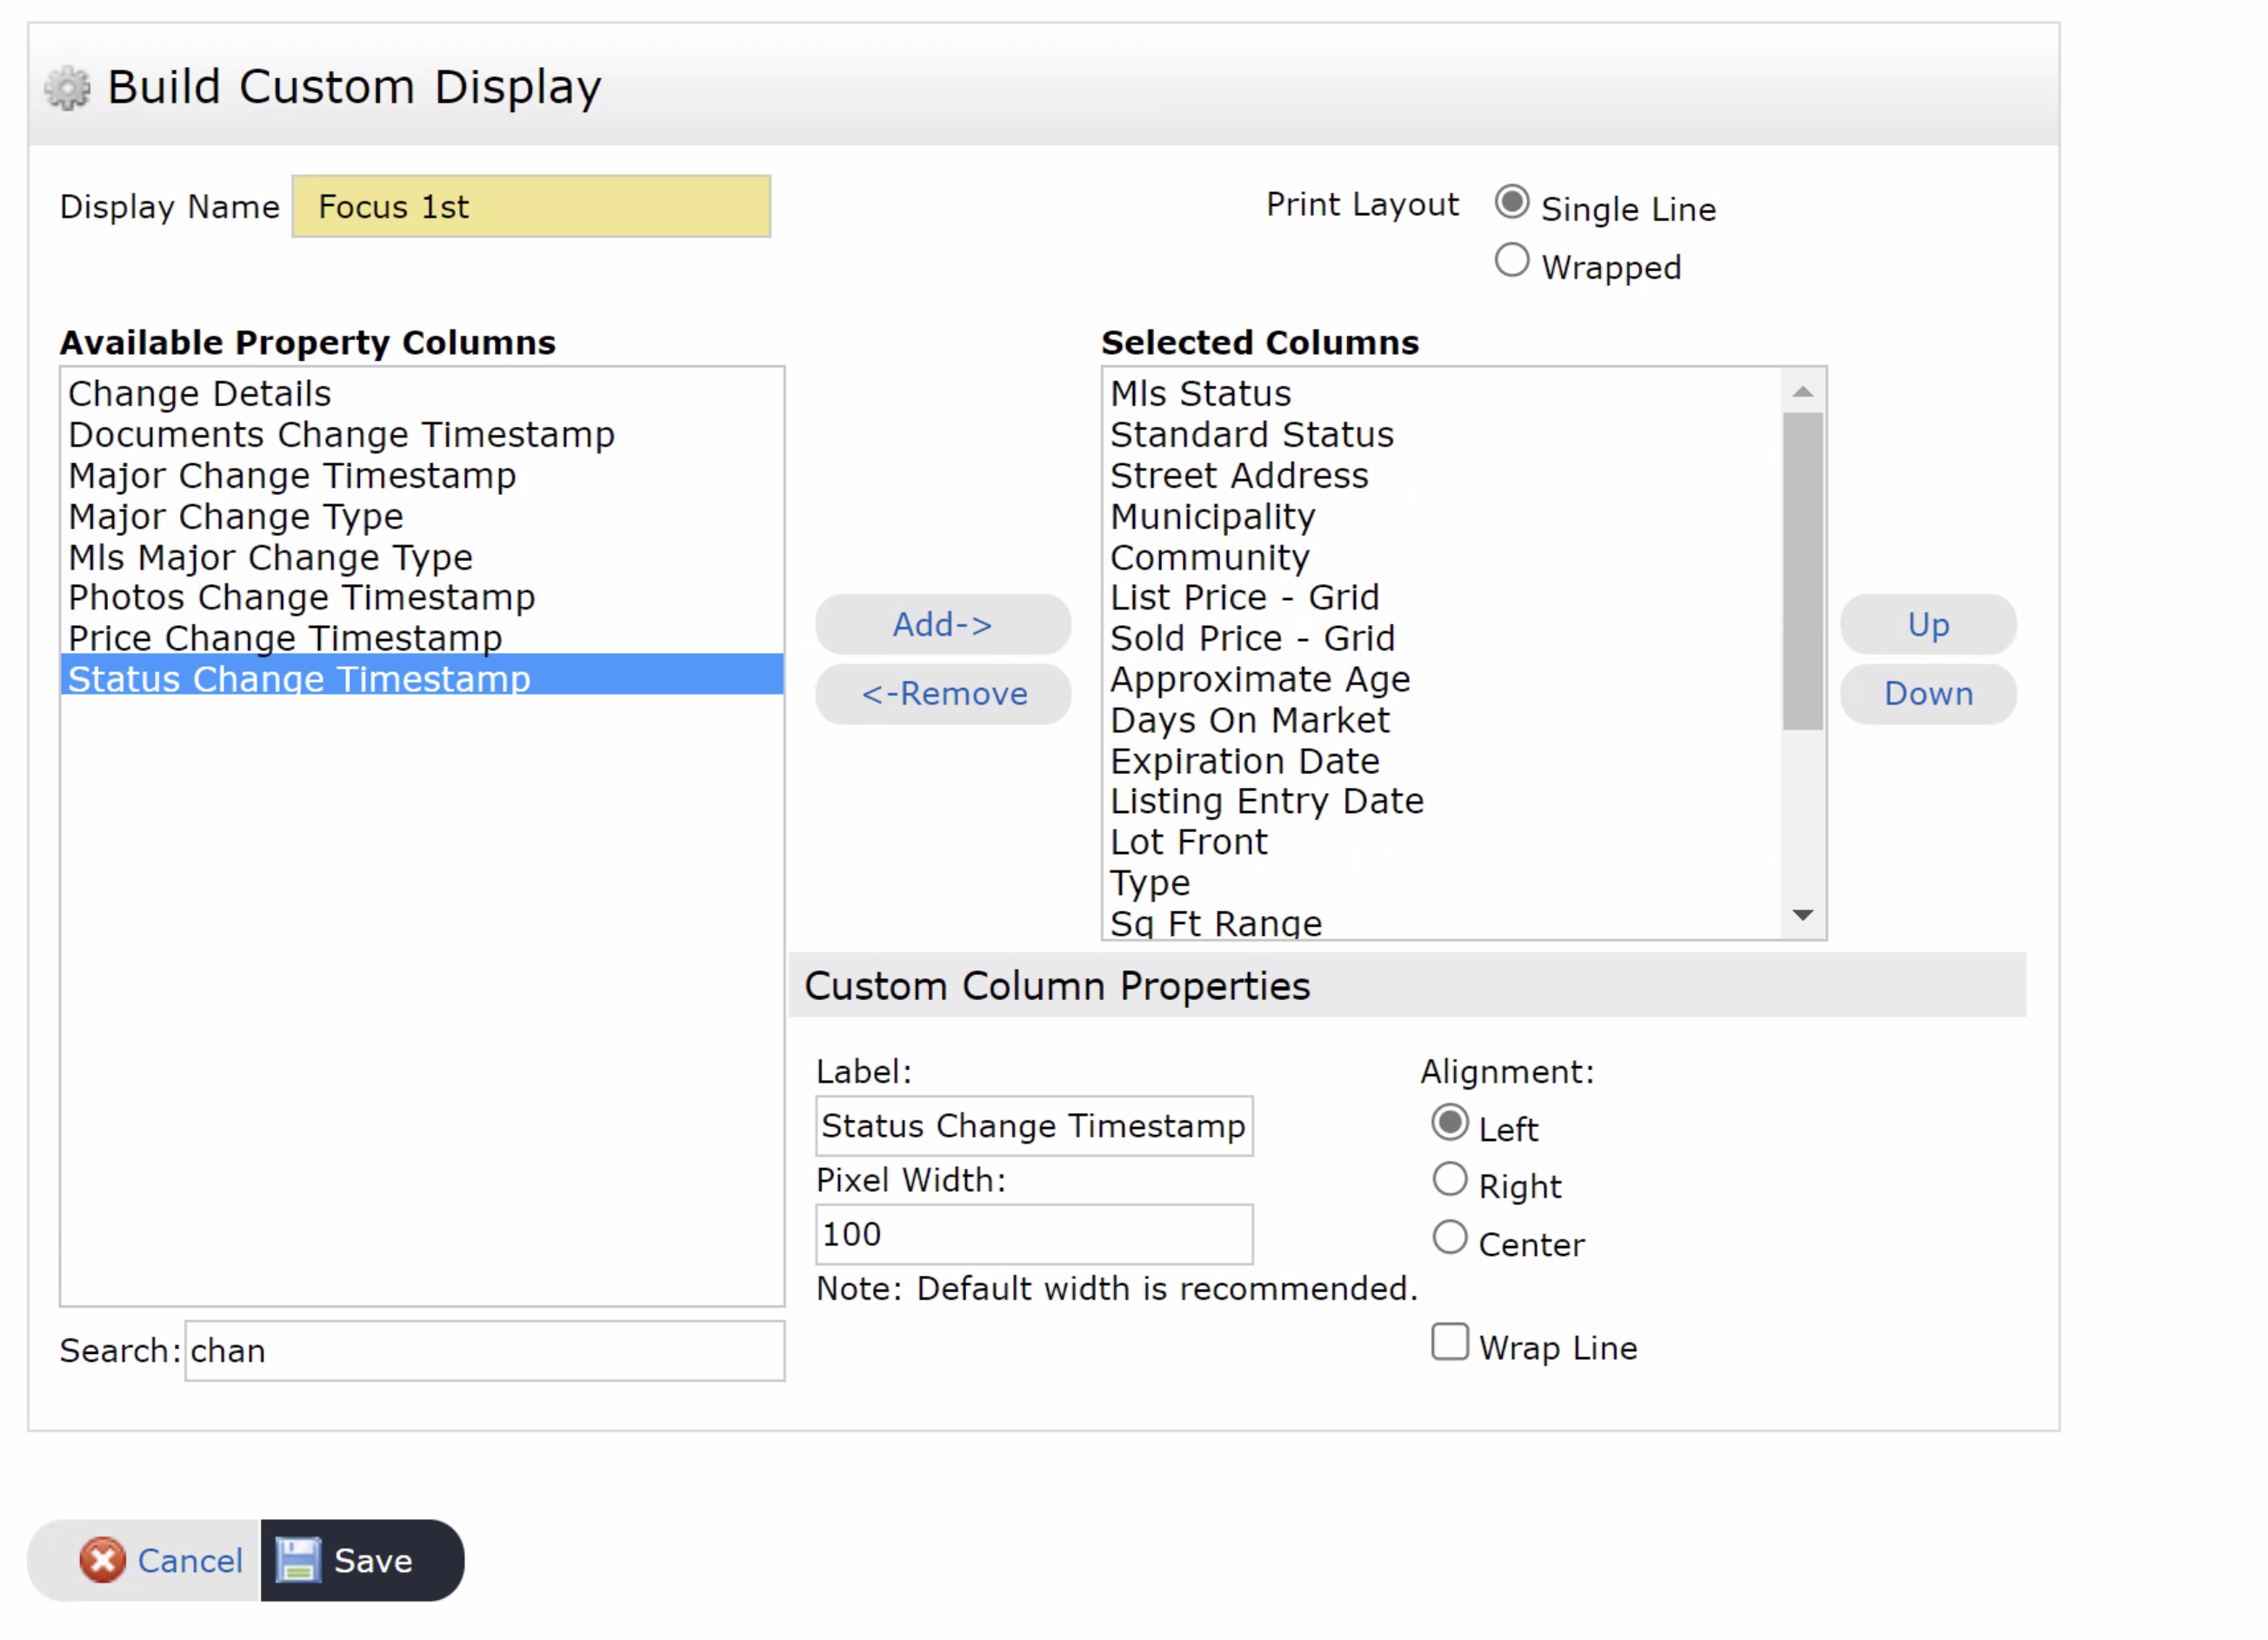
First place the name “Focus1st” as the “Display Name as shown Above.
Next, you will need to define the fields for the new Display format.
Doing the following will ensure the Custom Display (and Export) includes the required fields for the
software to
provide accurate results.
- Select the field names (see table below) to be selected from the AVAILABLE PROPERTY COLUMNS
table (on the left).
and added it to the SELECTED COLUMNS table (on the right) by
pressing the ADD -> button.
- You will see the field selected move to the table on the right.
Do this for each of the field names shown below.
Once you have added all the fields from the table above,
save the Custom Display by pressing the SAVE button.
The default Display includes several icons at the start of the Display format that we do NOT want to
be included.
Be sure to remove those icons by selecting the icon fields in the SELECTED
COLUMNS table (on the right)
and then by pressing the
<-REMOVE< /strong> button.
NOTE: The first field name needs be "MLS#"
followed by "MLS Status" field.
NOTE: The first field name needs be "Centris No."
followed by "Status" field.
The PRINT LAYOUT should already be set to
"Single Line"
(this is located at the top right area of the Build Custom
Displays dialog box).
NOTE: The first field name needs be "MLS#"
followed by "MLS Status" field.
NOTE: The first field name needs be "Centris No."
followed by "Status" field.
The PRINT LAYOUT should already be set to "Single Line" (this is located at the top right area of the Build Custom Displays dialog box).
2. Create your MLS search
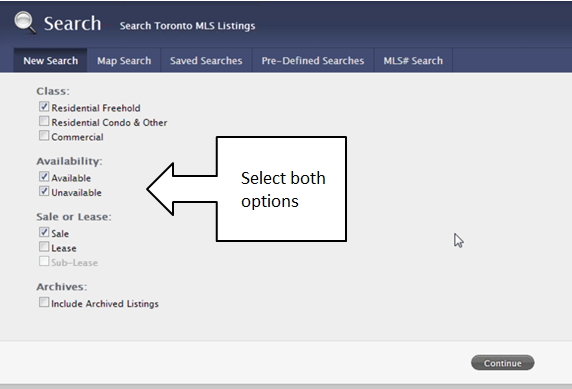
On the start Search screen, check that both the Available and Unavailable options are selected. This is to assure that you will find both active and
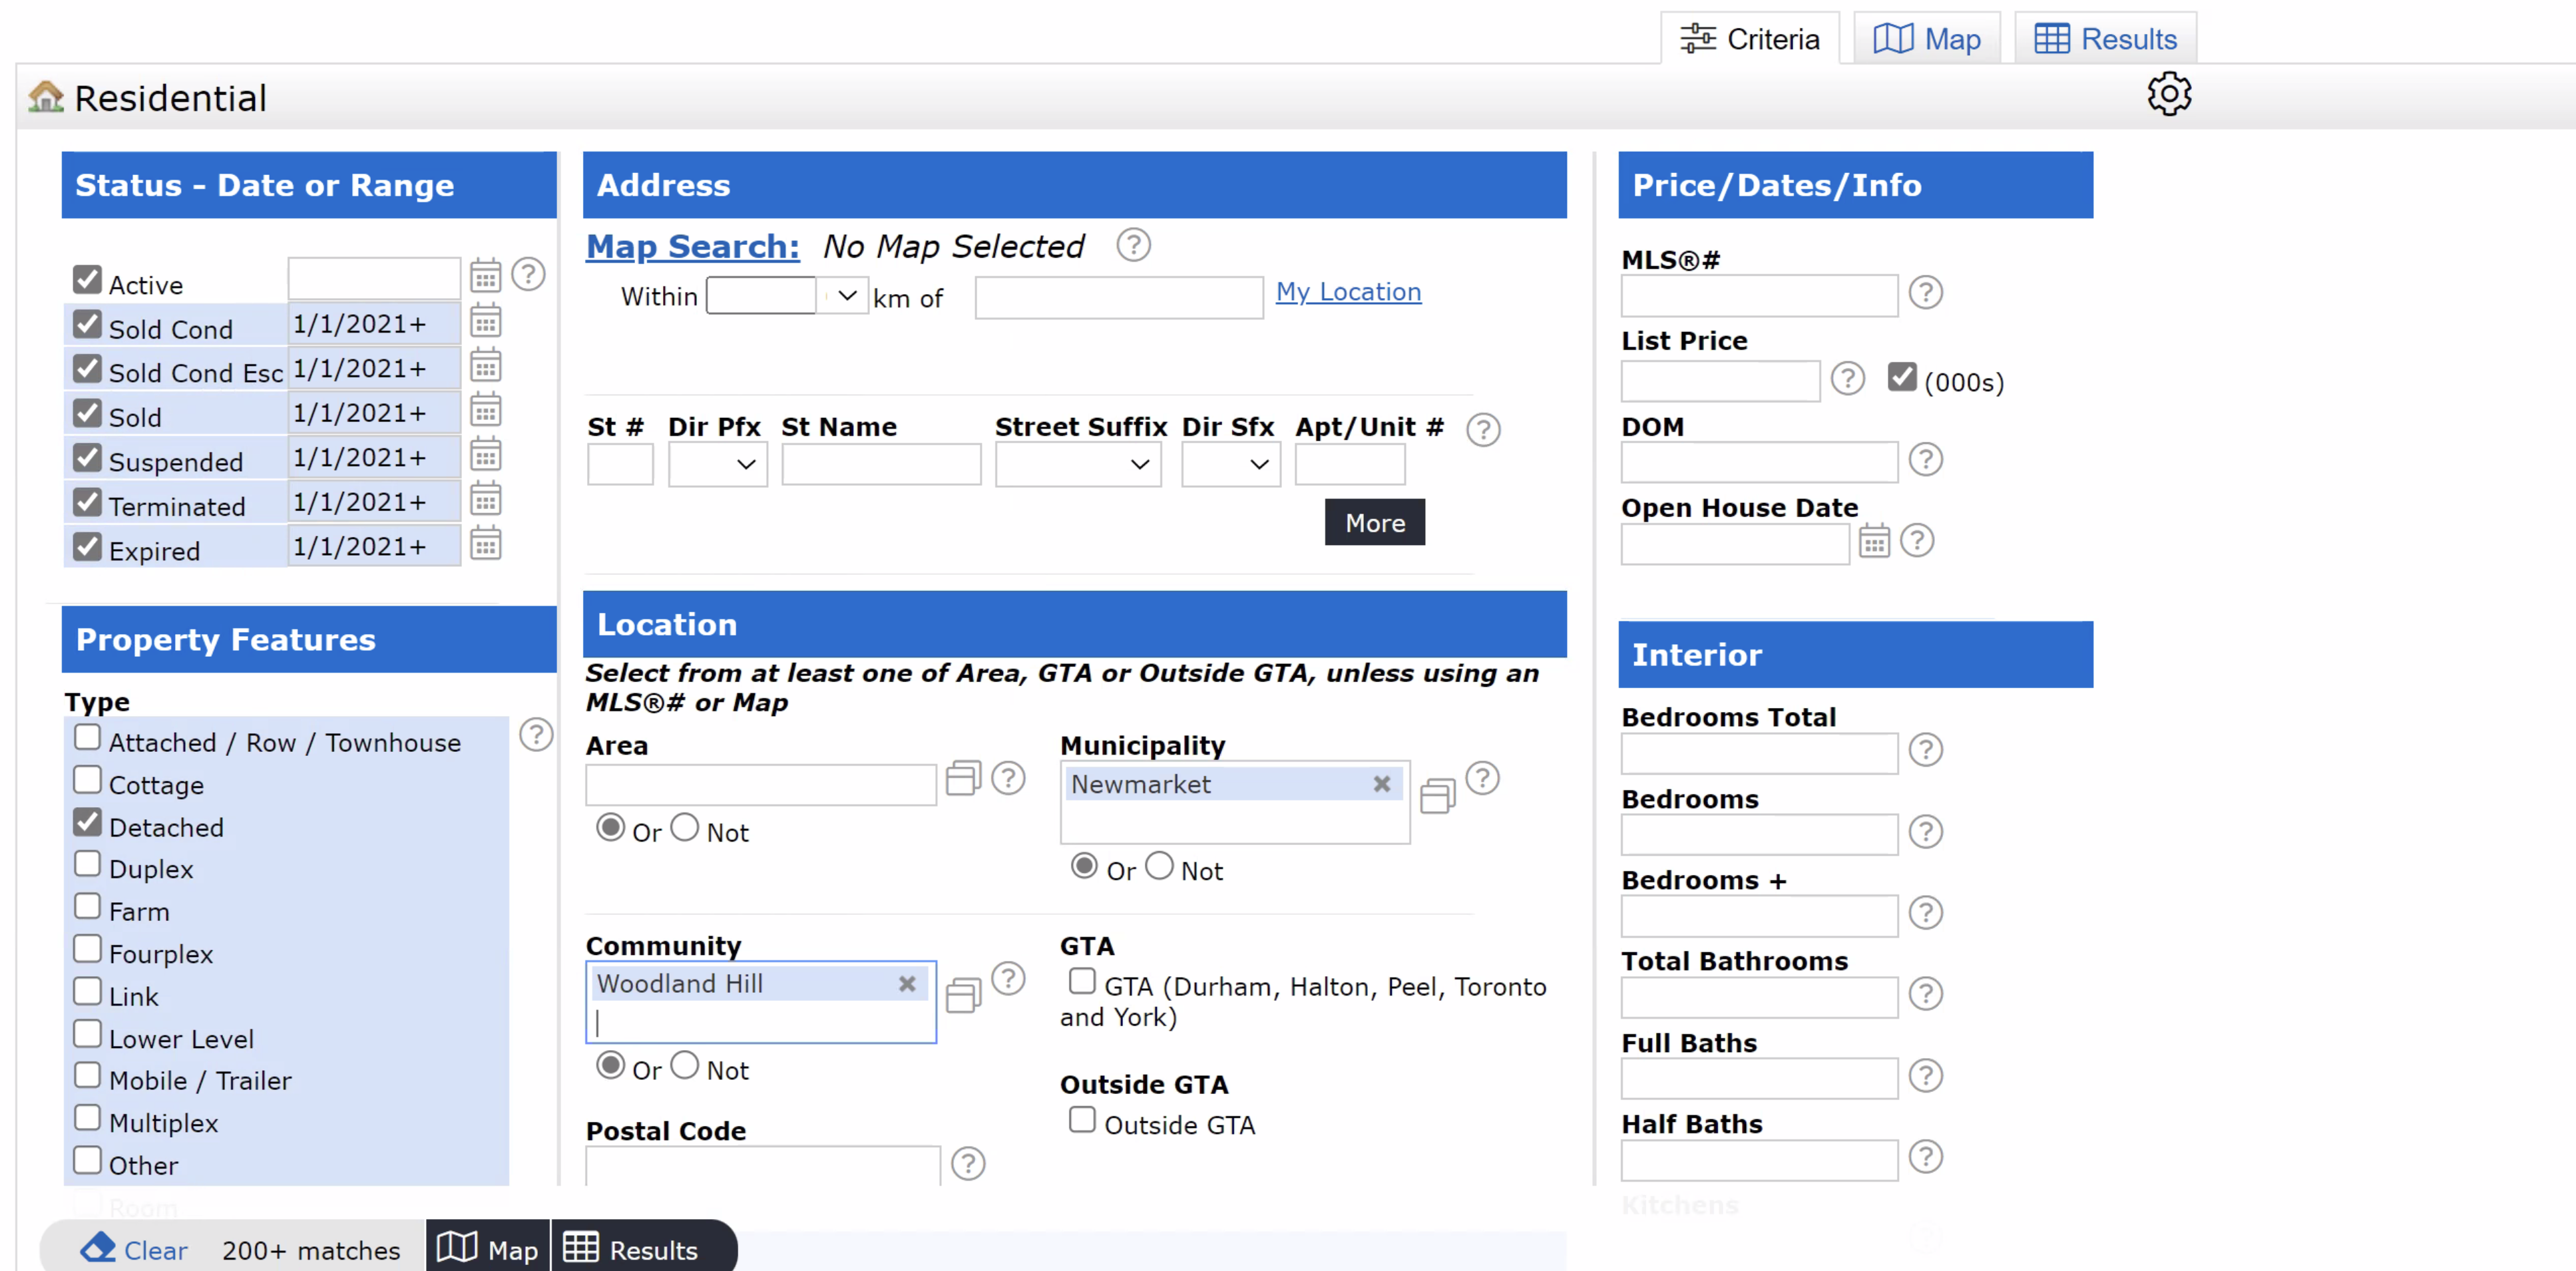
In selecting data, make sure that ALL status options are selected.
Selecting all status activity will ensure that all the data needed to create the graphs is collected.
Additionally, you will need to select the "Closed", "Withdrawn", and "Expired" dates to be two years
back.
When searching for all status activity for the last two years,
your search results should be in the 50 to 100 comparable properties range (this is a rough guideline).
If you have slightly less than 50 that works, or a little above 100 is fine as well.
You should also make your normal selection choice by selecting other options that you would normally select
in doing a CMA.
For example, options you would normally use when doing a CMA,
could include a map search (using a polygon), subdivision or neighborhood,
city, zip code, lot size (<.5 acre, 1-5 acres, etc. ), on water. Looking at activity in specific
subdivisions is also good starting point. For your initial search you want to focus on location
(location, location) and add in unique features (only if necesssary). To view a short tutorial on how to
do an effective search to use in your Focus 1st Pricing, select
this link.
Once you've selected the search criteria, press the SEARCH button
to see the results as shown below.
When searching for all status activity for the last two years, your search results should be in the 50 to 100 comparable properties range (this is a rough guideline). If you have slightly less than 50 that works, or a little above 100 is fine as well.
2. Create the Custom Display by adding the required fields.
Before you can export data, you must first customize the Display format by adding additional columns to
the search results.
This is a one-time action that you will need to do.
Once you have added the additional columns to your display you will not need to do this again and you
can skip this
section.
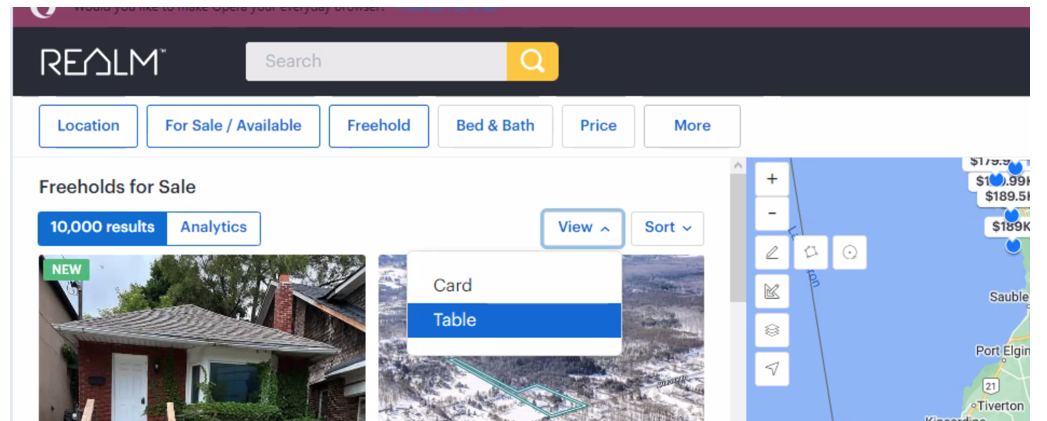
You must first change the format from the Card format
to the Table format.
To do this select the View down arrow and then select the
Table option as show above.
Once you've done that your screen should look similar to the search results shown below.

Now you are ready to add columns.
The columns you will add are shown in a table below.
To add the columns you need to
select the Columns down arrow (located at the right of the screen)
and then select the New option.
This will allow you to create a New column set.
Once you have created a New Column Set, name that set Focus 1st.
This will allow you to "Load" the new column set just before you export your data (if necessary).
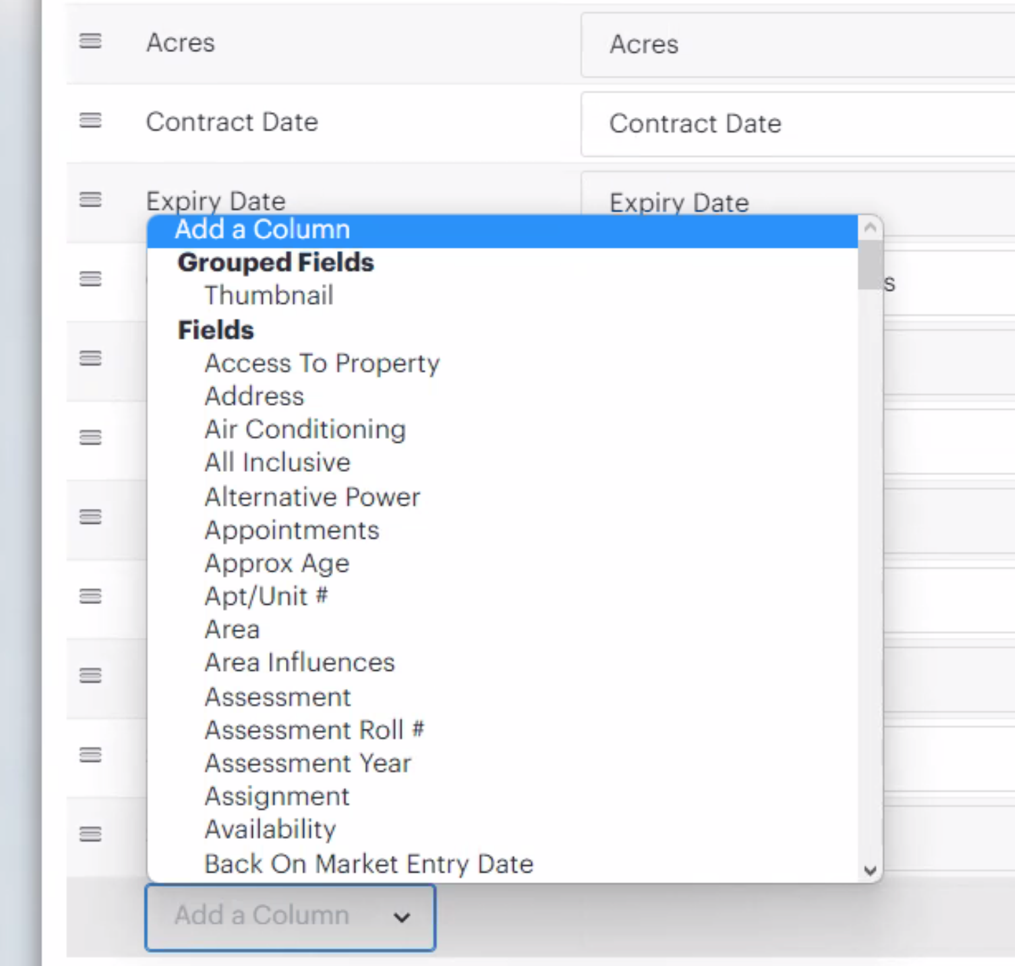
You are now able to add the columns that you need by selecting the Add a
Column
option located at the bottom of the Column screen as shown below.
When you add columns, it must be setup exactly as shown in this section for the Focus 1st
application to understand the format.
To add columns select the Customize option found at the top of the
search results.
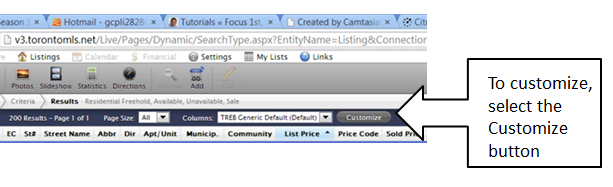
Once you've selected the Customize option,
you will then see the Customize Columns dialog box as shown below.
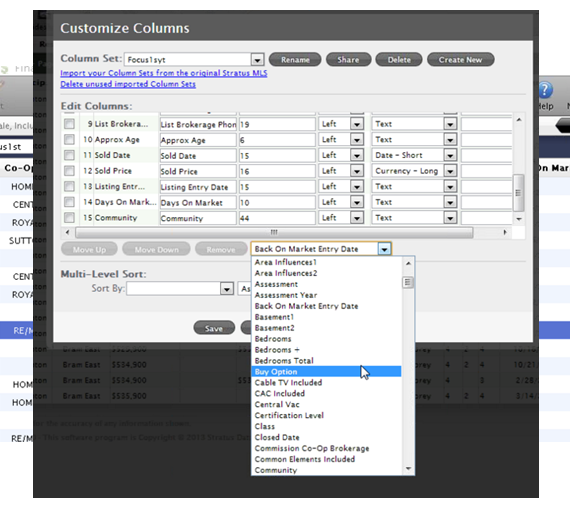
First place the name “Focus1st” as the “Display Name as shown Above.
You will need to find the columns to add the search results.
First be sure to start off with the TREB Generic Defalut (Default)
definition.
This will add the default columns that you will need to start with.
Doing the following will ensure the Custom Display (and Export) includes the required fields for
the
software to
provide accurate results.
- Select the column to be selected from the drop down menu just below the Edit
COLUMNS area,
and add it to the EDIT COLUMNS table by selecting the
column name.
- You will see the column selected added to the table above.
Do this for each of the column names shown below.
Once you have added all the columns, save the Custom Dsiplay. You will need to use this display format when you are ready to export your results.
Once you have added all the columns,
save the Custom Display by pressing the SAVE AS button,
and rename the new format to "Focus 1st".
You will need to use this display format when you are ready to export your results.
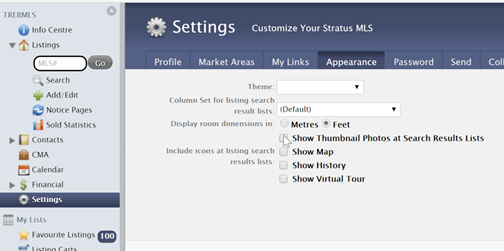
The default search results may include the thumbnail photos column
at
the start of the Search Results that we do NOT want to be included.
To turn off the thumbnail photos column,
go to Info Center -> Settings and then make sure that the
Show Thumnail Photos at Search Results Lists is turned off (as show
below).
Then re-run your search to make sure that you have search results without the thumbnail photos
column.
3. Export your results

To export results, first CHECK all the properties.
To check all the properties at the top of the search screen,
select the All option (next to the checked counter).
You will see all the properties check boxes checked (located on the left side of the results screen)
and all the properties highlighted.
Also be sure that the Display is set to my:Focus1st
to display the Focus1st display format.
The Display function is just to the right of the checked counter.
If it is not selected, select it using the dropdown menu.
It will probably be set by default.
Also, to export more results, we recommend that you display 100 properties per page
(the default is to show only 25 properties per page).
Also, to export more results, we recommend that you display 100 properties per page (the default is to show only 25 properties per page).

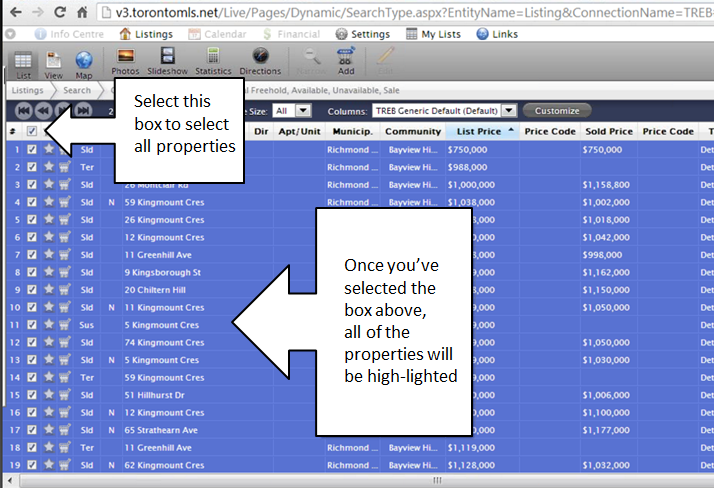
To export results, first CHECK all the properties.
To check all the properties at the top of the search screen,
select the small box at the top of the search results.
You will see all the properties check boxes checked (located on the left side of the results screen)
and all the properties highlighted.
Be sure that the Columns is set to Focus1st
to display the Focus1st display format.
The Display function is just above and to the right of the checked
counter.
If it is not selected, select it using the dropdown menu.
Also, to export more results, we recommend that you display 100 properties per page
(the default is to show only 25 properties per page).
Also, to export more results, we recommend that you display 100 properties per page (the default is to show only 25 properties per page).
You are now ready to export your results. To export the results, while on your search results screen, position the cursor over the highlighted search results. Then right-click and select the Save As option.
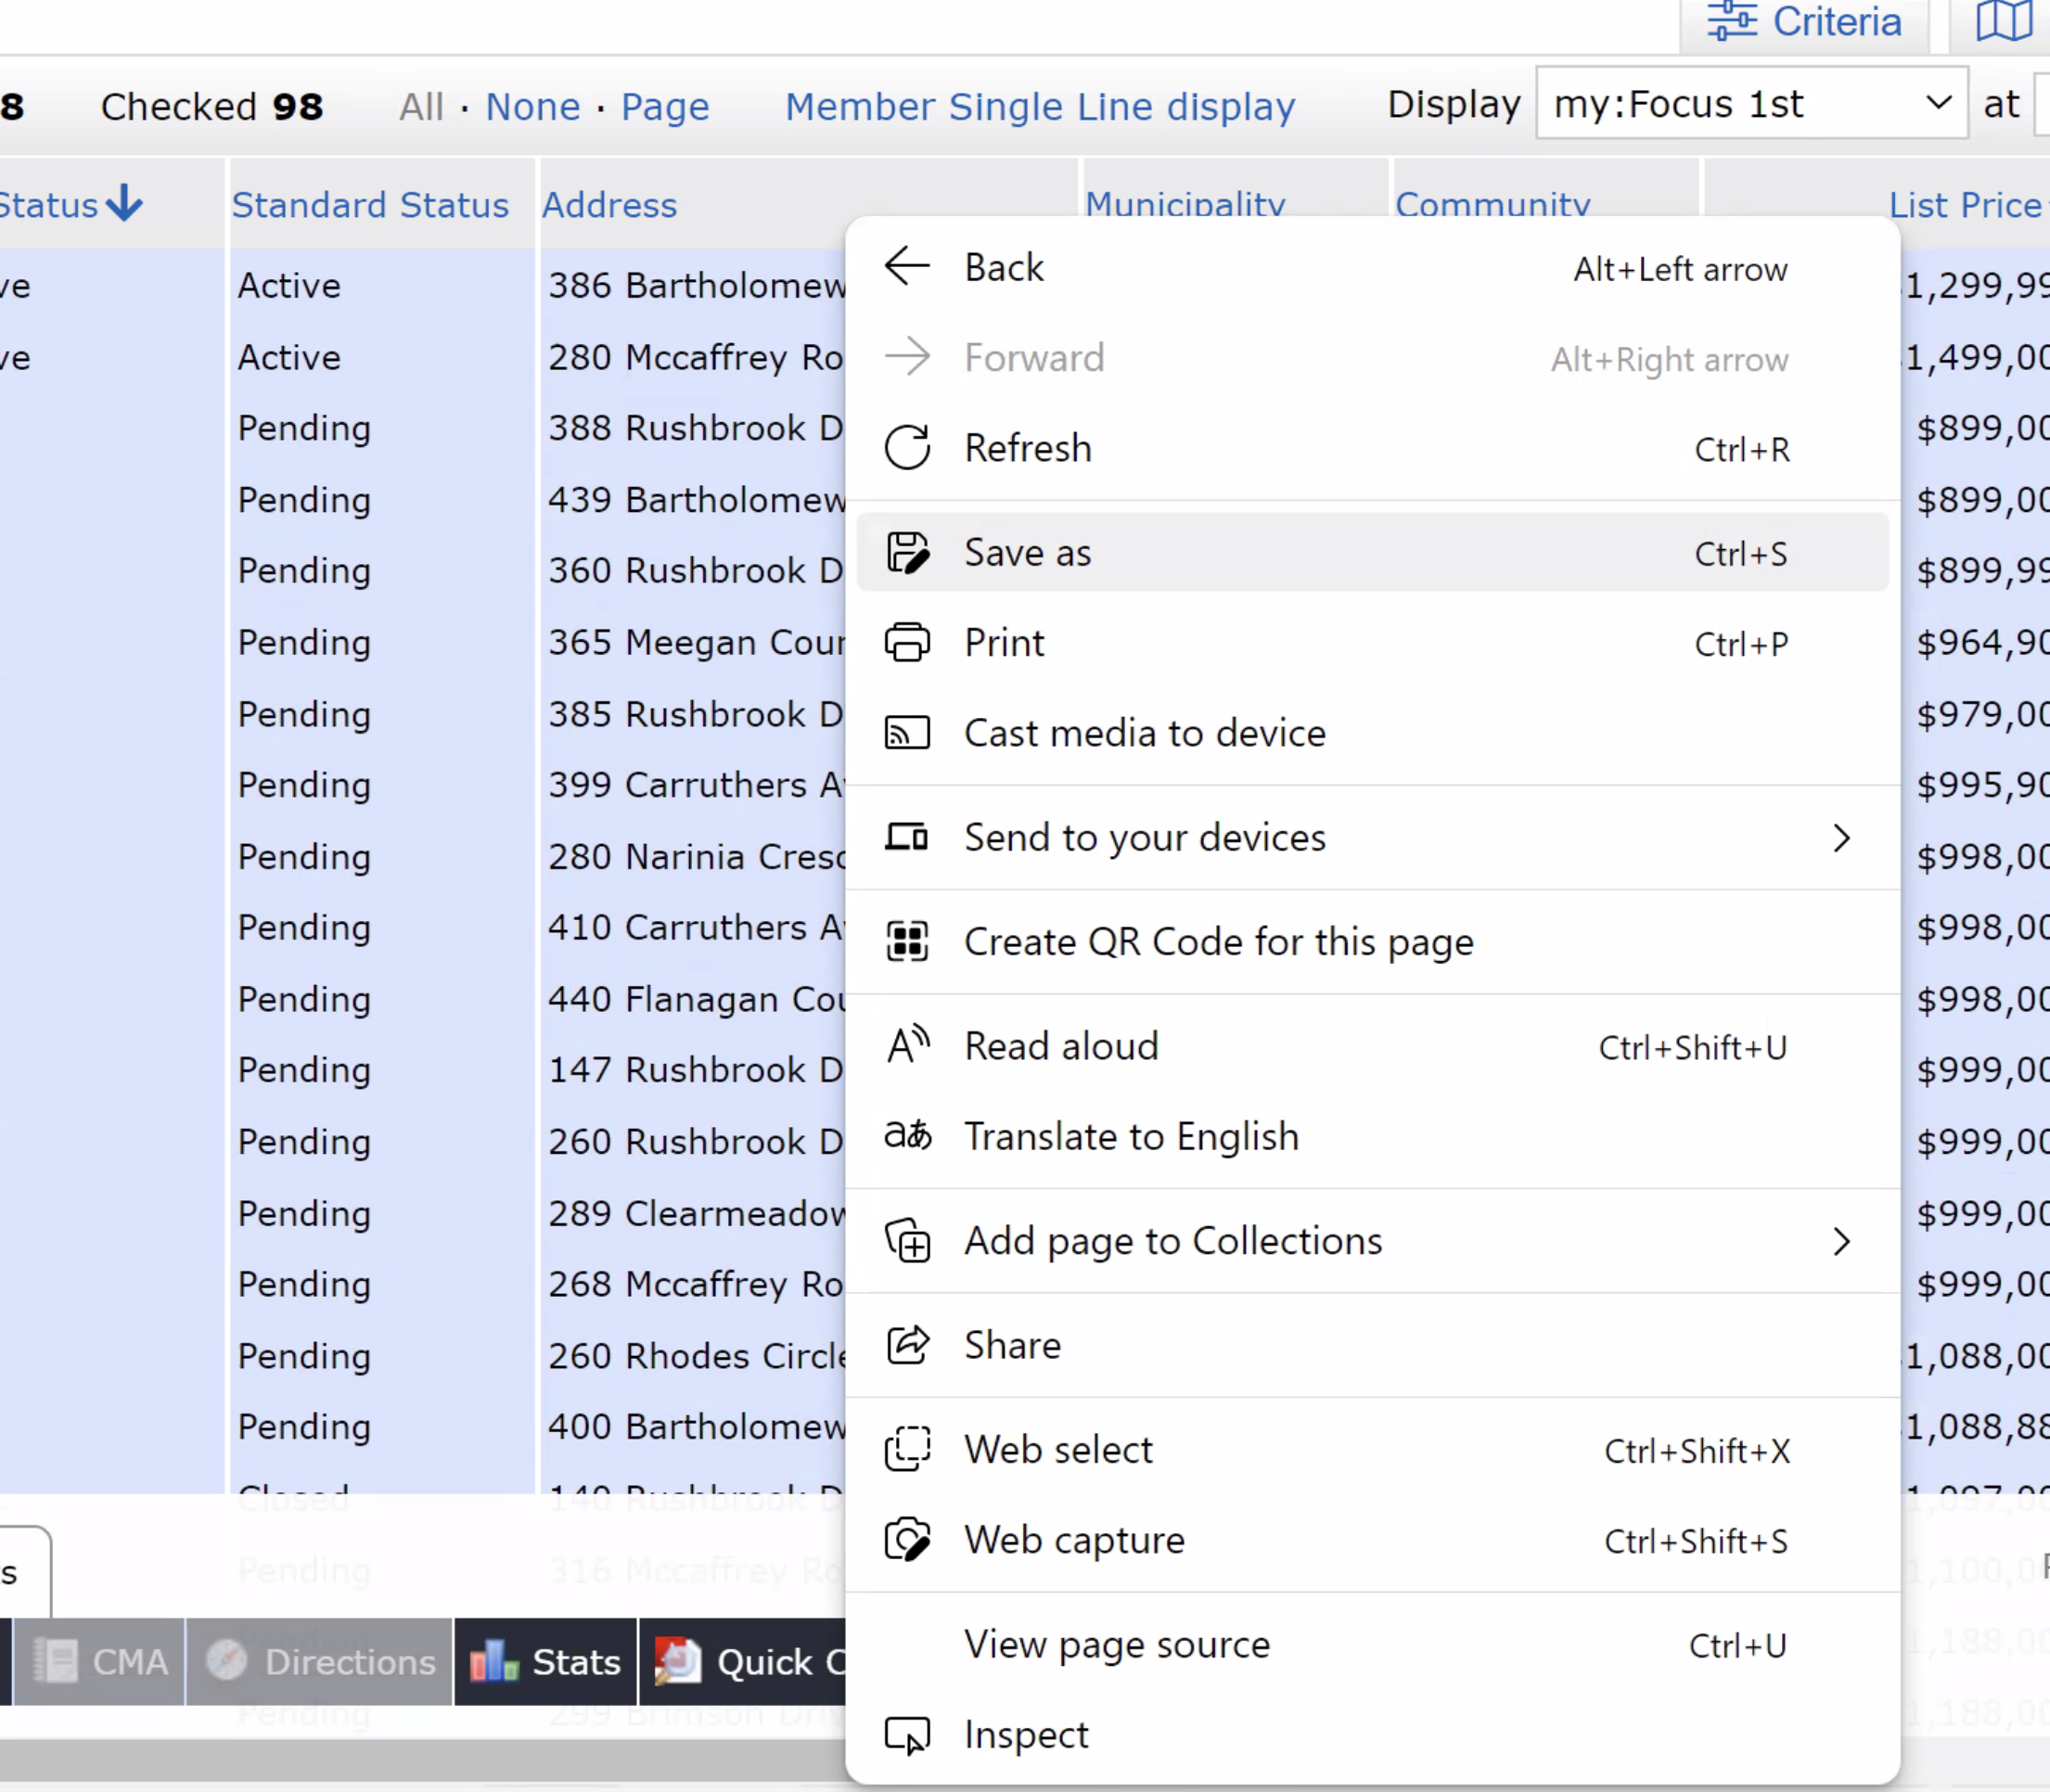
Once you have selected the Save As option,
you will see a dialog box similar to that shown below.
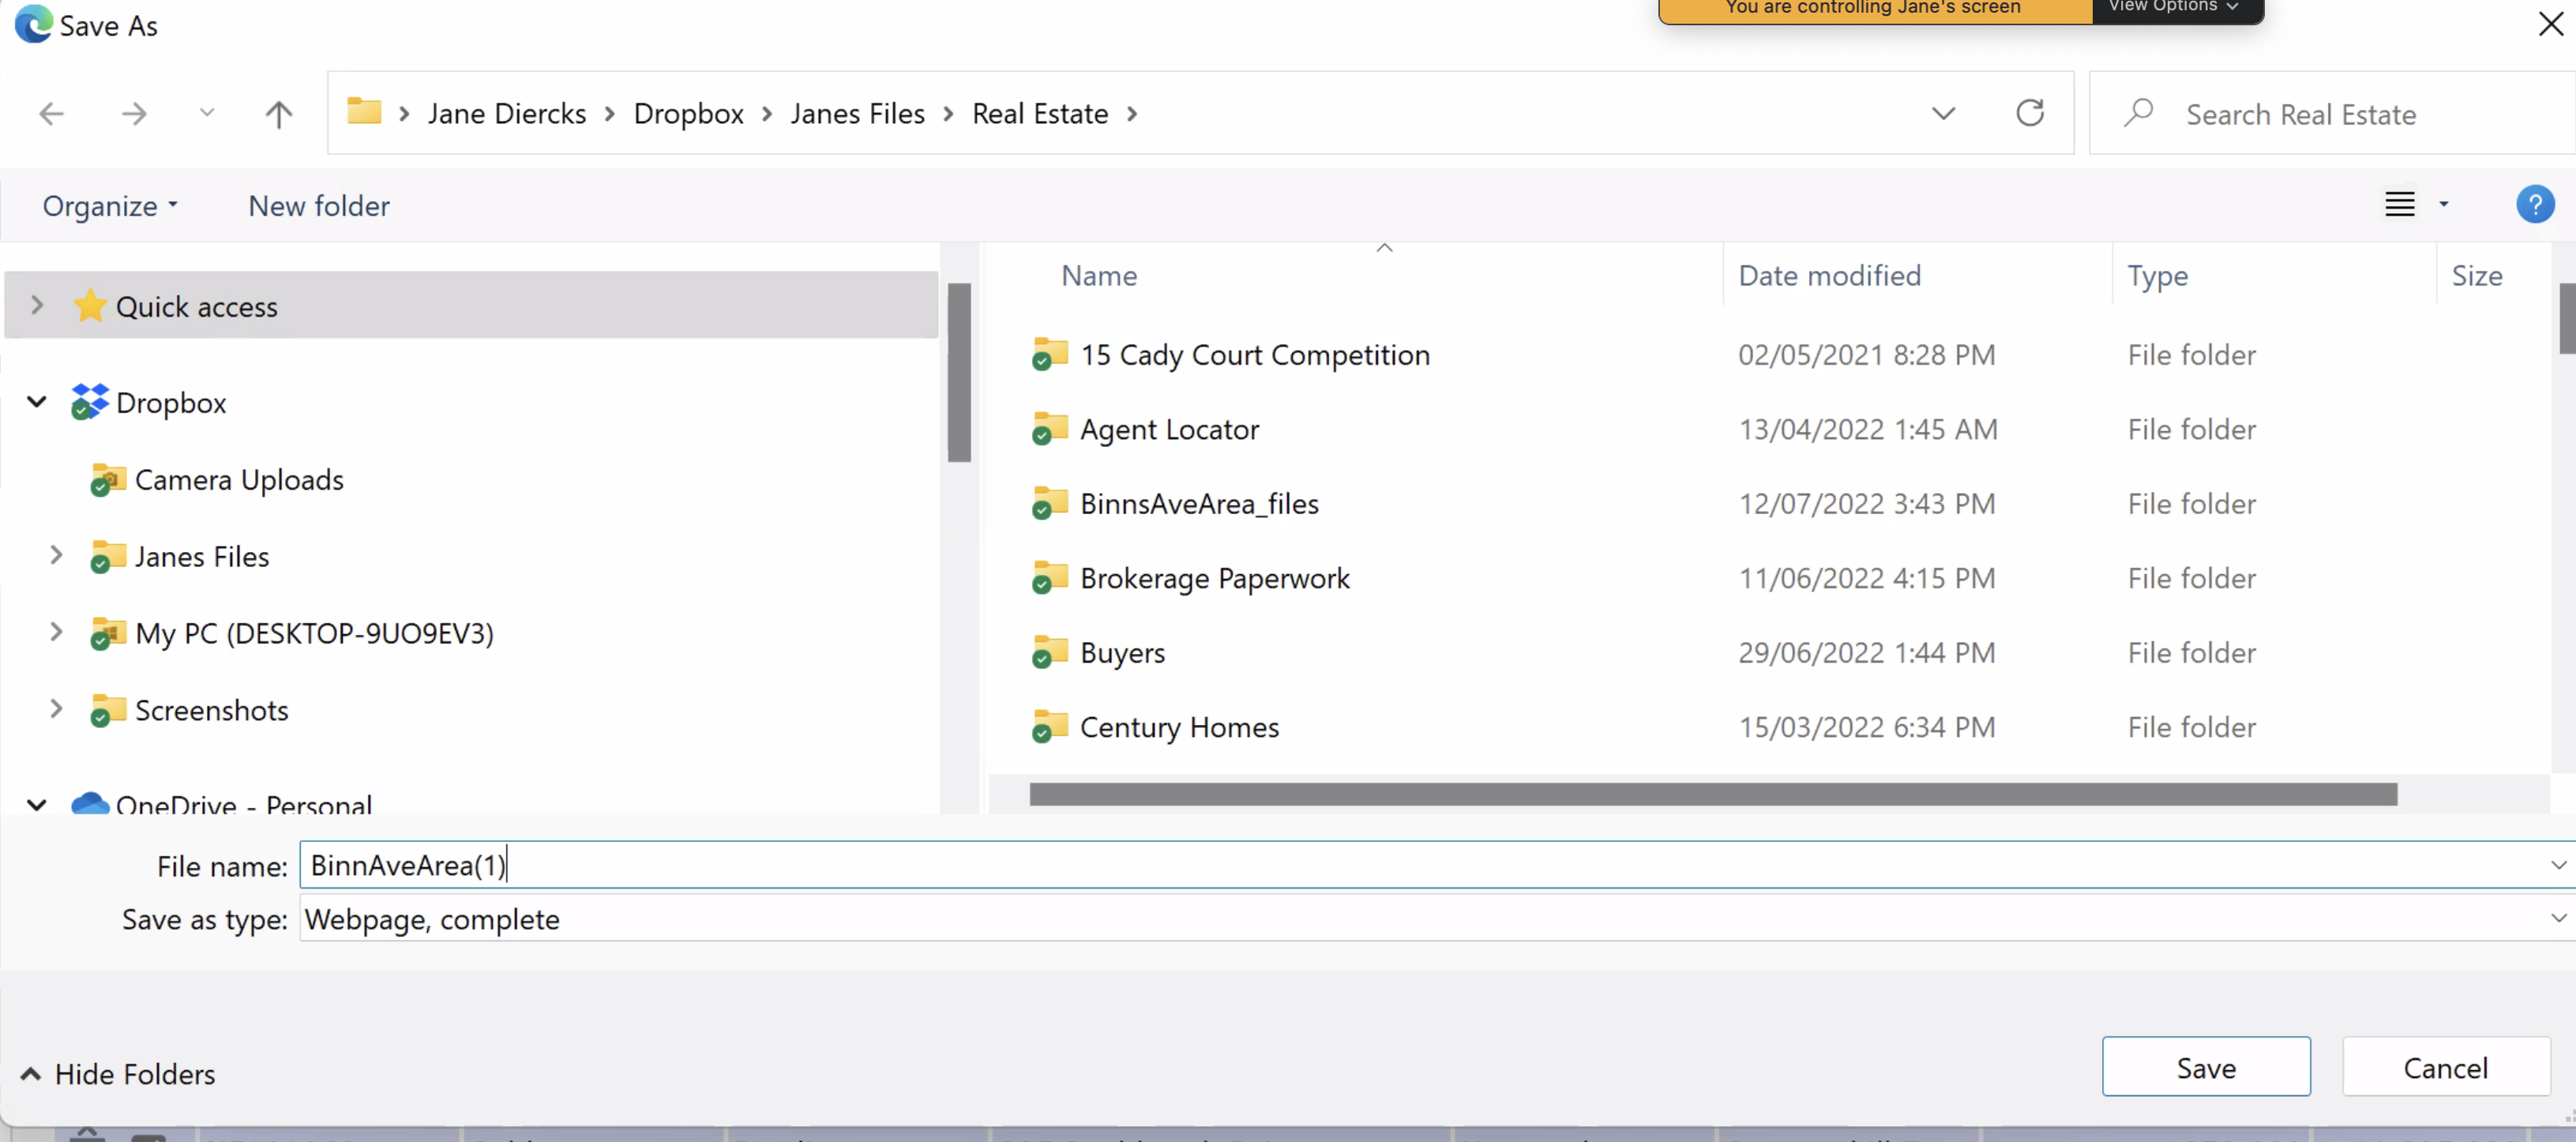
Select the Webpage, Complete Save As Type and choose
a location to save the file and a file name that you will recognize as the search
results that you've just saved.
NOTE: To have access to the "WebPage, Complete" format, you may need to use the "Chrome"
browser.
When you run the Focus 1st software,
you will need to find the saved (exported) data file, in the folder location where you saved it.
It may make sense to move the file to a location that is easier to find.
Notice that the file you are exporting will be a webpage file or a filename ending in 'html' .
The mls data is included in the 'html' file.
Additionally, there will be a folder associated with the file that is created as well.
That folder is not used by the Focus 1st Pricing System.
When you read in the data from the mls from the Focus 1st Pricing System,
you will read in the 'html' file.
When reading in data from the REALM mls,
the MLS will only allow you to export a single page of information at a time.
As a result you may need to export mutiple files.
You are able to export each page by going to each page and then exporting that data use the export
process above
(selecting all the data on the page and then using the Save As option)
If you do, the Focus 1st Pricing is able to read in multiple files.
To read in multiple files be sure to use the Settings -> Enable Multiple
Files option.
For a short video on how to do your search, and export your results to downloaded into the
Focus1st Pricing software, select this
link.
When reading in data from the REALM mls, the MLS will only allow you to export a single page of information at a time. As a result you may need to export mutiple files. You are able to export each page by going to each page and then exporting that data use the export process above (selecting all the data on the page and then using the Save As option) If you do, the Focus 1st Pricing is able to read in multiple files. To read in multiple files be sure to use the Settings -> Enable Multiple Files option.
For more instructions on how to run the Focus 1st software, be sure to check out our Youtube channel by
selecting this link:

Additional Pricing Considerations for the Toronto/Montreal Area
There are additional considerations you should have in mind when doing a market analysis in the Toronto and Montreal areas.
There are five factors which are used in doing a market analysis: location, size, price, special
features, and condition.
With scattergrams, you are able to summarize all of these factors on one graph.
In most cases, the local MLS is a key source for all this information.
The Toronto and Montreal MLS' do not always provide square footage values for the properties found in the MLS (this of course is because users don't enter those values). As a result, graphing based on square footage won't provide the result you are looking for.
Of course the public records does have square footage values for the properties.
In many cases, users in these areas will copy over values from public records
to the MLS Data Form,
for the properties that they want to add to their scattergrams.
This can be a successful process when adding data for a limited number of properties.
How does someone price based on size when there is no square footage data available? One of the ways we suggest is to base it on number of bedrooms. While the number of bedrooms isn’t as accurate as square footage, generally more bedrooms mean larger-sized properties. Since you aren’t able to create a graph showing price compared to square footage, we suggest that you take a look at price compared to the number of bedrooms. This will help you focus in a price range.
Additionally, we’ve also added the ability to price based on the number of bathrooms.
When you do look at pricing based on the number of bathrooms,
we suggest that you only include properties on the graph that already have the same number of bedrooms.
The logic here is that if you take two homes with the same number of bedrooms,
and one of the homes has more bathrooms, then in most cases, the home with more bathrooms will be
larger.
Of course, as we suggest with scattergrams where you are showing square footage, we suggest that you “summarize” the special feature/amentities and condition for specific “comparable” properties. We suggest that you do that for graphs that compare bedrooms (or bathrooms) and the price.
One last Item.
We’ve also heard from Realtors in Toronto that the property frontage can also be a huge indicator of
price as well.
As such, we’ve also included added the frontage field to the one line description in the MLS data form
and we've added the ability to graph results based on the frontage.