Exporting
Data from TX,
San Antonio –Connect MLS
Connect MLS
In
selecting data from Connect MLS be sure to select the two options below:
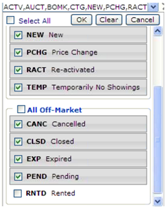
Select
all status activity for the last two years.
Make sure that all the status options are selected (don’t need to select
rental activity). Then search for all
activity for the last two years. These
options will make sure that all the data that is needed to create the
appropriate graphs, is collected.
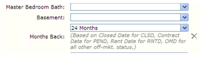
You
should also make your normal selection choice by selecting other options that
you would normally select in doing a CMA.
As mentioned earlier, looking at activity in specific subdivisions or
neighborhoods is a good starting point or use the map search feature to find
all the activity near the subject property.
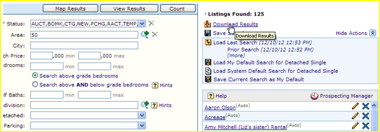
Once
you’ve selected the search criteria, you may download your results. To export data, select the “download” button
as shown in the graphic below.
Once
you press the “Download” button, you will see a dialog similar to the one shown
below. Select the “Toolkit CMA fields”
option.
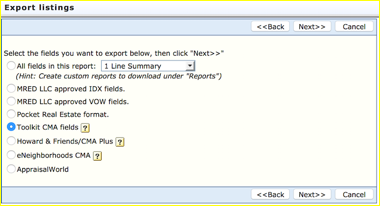
Then
press the “Next” Button. After you press
the “Next” button, you will see a screen similar to that below.
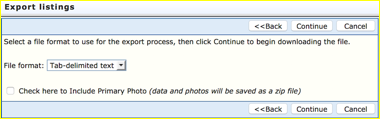
As
you will see, the default format is the “Tab-delimited text” format. This is format you want to use, so select the
“continue” button. Once you select the
“Continue” button, you will see a screen similar to that shown below.
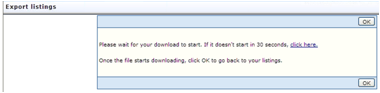
To
download your data, select the “click here” link. Once the download starts, you will be asked
if you want to save the file. Select the
‘Save’ option and then select a filename.
Be sure to remember where you save your
file. This is the exported file that
will be used to create your graphs.
Once
you have saved your exported file, you are ready to run your application. When you run the application you will need to
find to the exported data file, so make sure that you’ve placed the file in an
easy to find place.
For
instructions on how to run your application, be sure to see the tutorial on the
Focus 1st website.