Exporting Data from RealTracs MLS - Tennessee
RealTracs
In
selecting data from RealTracs be sure to select the
two options below:
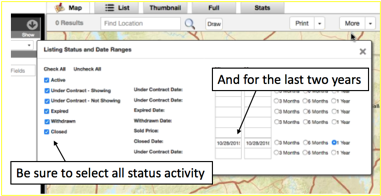
Make
sure that all the status options are selected.
Then make sure the “Min” dates will include at least two full calendar
years 1/1/20xx. These options will make sure that all the data that is needed
to create the appropriate graphs, is collected.
You
should also make your normal selection choice by selecting other options that
you would normally select in doing a CMA.
As mentioned earlier, looking at activity in specific subdivisions is a
good starting point.
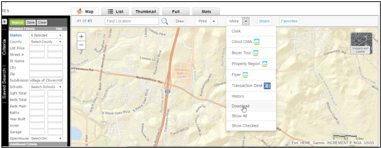
Once
you’ve selected the search criteria, you are ready to download the
results. To download the results,
select the ![]() option that can be found under the “More”
dropdown as shown below.
option that can be found under the “More”
dropdown as shown below.
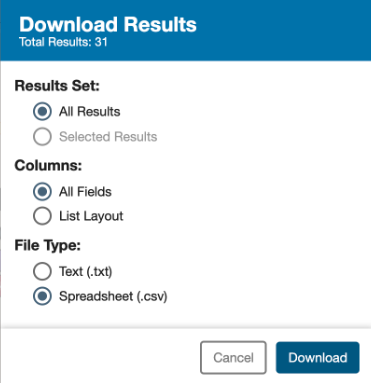
When you select the download button, the dialog shown
below is displayed. Select Download Results
“All Results” Columns “All Fields” choices and File Type “Spreadsheet (csv)”
download format. Then push the
“Download” button.
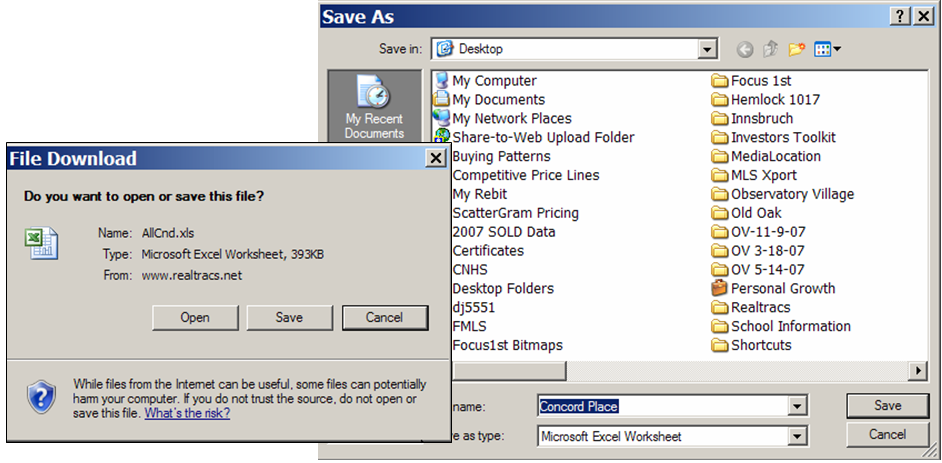
Once
the download starts, you will be asked if you want to save the file. Select the ‘Save’ option and then choose a
filename.
Be sure
to remember where you save your file.
This is the exported file that will be used to create your graphs.
You
will see dialog boxes similar to what you see below.
Once
you have saved your exported file, you are ready to run the Visual Pricing
System. When you run the application you
will need to point to the exported data file, so make sure that you’ve placed
the file in an easy to find place. For
instructions on how to run the Visual Pricing System, be sure to see the online
tutorial located at www.focus1st.com
.