Exporting
Data from CAN, Ontario,
Windsor-Essex
Using the “Custom
Export” to setup the Export Format
Before
you can export data, you must first setup the Export format. This is a one-time action that you will need
to do for each search type. So that
means you’ll have to create a “Custom Format” for the “Quick Search”, “Residential
Search” and/or “Multi-family Search” if you use those searches. The format must be setup as shown in this
section for the Visual Pricing System application to understand the
format. To create your custom format, once
on the search screen, select the “custom format” button.
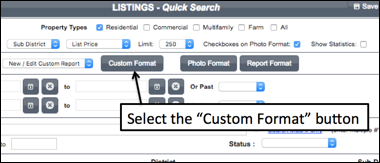
Once
you select the “Custom Format” button, you will see a screen similar to that
shown below.
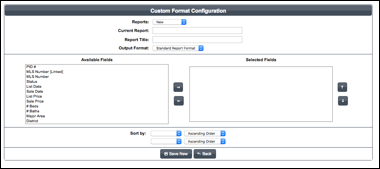
First
place the name “Focus 1st” in the “Current Report” and “Report Title”
fields. The in the “Output Format”
field, select the “Comma Delimited (.csv)”
option. Next you will need to select the
fields to be in the new custom format.
To select the fields, select a field from the left table (shown as
“Available Fields”) and press the ![]() key. You will see the item move to the table on
the right (shown as “Selected Fields”).
key. You will see the item move to the table on
the right (shown as “Selected Fields”).
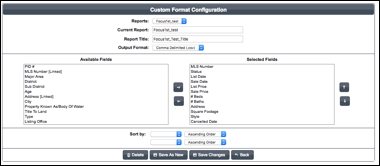
Do
this for each of the fields as shown in the list below.
Be
sure to add the fields shown below:
·
MLS
Number
·
Status
·
List
Date
·
List
Price
·
Sale
Price
·
#
Beds
·
#
Baths
·
Address
·
Closing
Date
·
Square
Footage
·
Style
·
Cancelled
Date
·
Expiry
Date
Once you
have completed the task above, save the results by pressing the “Save New” button. You are now ready to do your MLS search and
export results.
CAN, Ontario,
Windsor-Essex
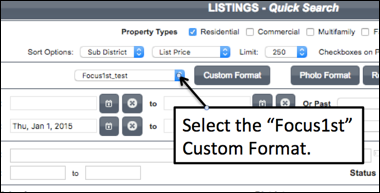
In
selecting data from your MLS, first select the “Focus1st” custom format option
that you defined. You will select this
option next to the “Custom Format” button as shown below.
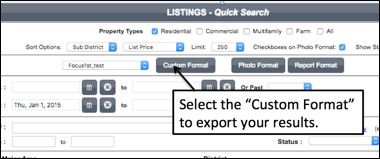
Make
sure that all the status options are selected.
This option will make sure that all the data that is needed to create
the appropriate graphs, is collected.
You
should also make your normal selection choice by selecting other options that
you would normally select in doing a Market Analysis. As mentioned earlier, looking at activity in
specific subdivisions is a good starting point.
It is
also recommended that you include data from the last two year to enable you to
see the recent patterns.
Once
you’ve selected the search criteria, press the ‘Custom
Format” button to export your results.
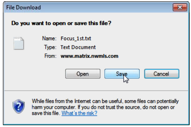
Next
you will see the screen shown below.
Select the “Download file” button to download your results.
![]()
The
download will now start. Once the
download starts, you may be asked if you want to save the file. Select the save option and then choose a file
name.
Be sure
to remember where you save your file.
This is the exported file that will be used to create your graphs.
You may
see dialog boxes similar to what you see below.
Once
you have saved your exported file, you are ready to run the application.
When
you run the application you will need to point to the exported data file, so
make sure that you’ve placed the file in an easy to find place.
For
instructions on how to run the application, be sure to see the tutorials located at http://www.focus1st.com.