Exporting Data from CAN,
BC, Vancouver Island – Interface Express
In
selecting data from Interface Express, be sure to select the options below:
·
You
should also make your normal selection choice by selecting other options that
you would normally select in doing a CMA.
As mentioned earlier, looking at activity in specific subdivisions
(location) is a good starting point.
·
Make
sure that all the status options are selected.
This option will make sure that all the data that is needed to create
the appropriate graphs, is collected.
·
It
is also recommended that you include data from the last two year to enable you
to see the recent patterns.
Once
you’ve selected the search criteria, press the ‘Search’
button to see the results as shown below.
Now you are ready to download the results. To download the results, first select the
“Custom Grid View” using the drop down arrow in the
“View As” option as shown below.
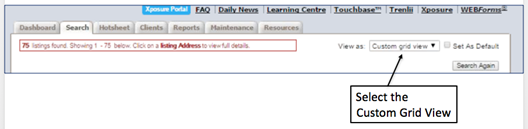
Once
you select the “Custom Grid View” you will see the interface changes.
Create
an Export Grid Format
Next
you will need to create an Export Grid Format that include all the necessary
field shown below. This is a one-time
action that you will need to do. To
create the Customized Export Grid Format, use the “Columns” drop down menu
located just above the grid on the right-hand side. Once you select the “Columns” drop down,
choose the “add/remove columns” action.
You will then be presented with a dialog box like that shown below.
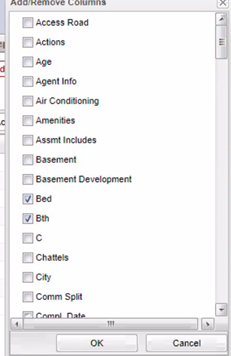
Using
the box and scrolling up and down, select the following field names to be
included in your grid by checking the box next to the respective field name.
·
Bed
·
Bath
·
DOM
·
Date
Chnged
·
Date
Entered
·
Date
Sold
·
List
Date
·
MLS
#
·
Office
/ Change
·
Price
·
Status
·
Style
·
Sub
Area
·
Subdivision
·
Total
SqFt
·
Unit
·
Yr
Blt
(Note
that several fields such as Address, Status, etc. are already included.)
Be sure
save your customize grid so that you can easily select the grid again in the
future without having to redefine it. You can save your customized grid by
using the “Columns” drop down menu and selecting the “Save Current Column
Arrangement As”.
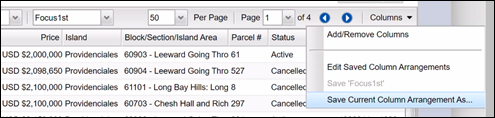
You can
name your Customized Grid what you’d like.
In this example we’ve named it “focus1st”.
Then
be sure that under the Default Columns area that your “Focus1st” Customized
Grid is selected.
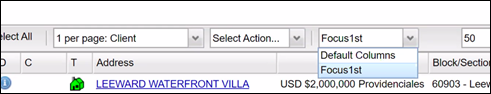
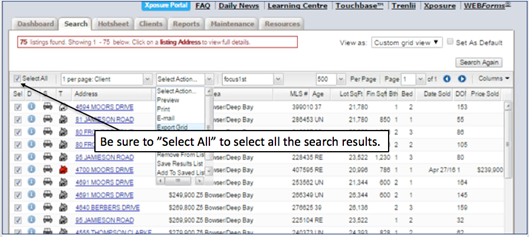
Next
you will want to be sure that all your search results have been selected. To do so select the “Select All” box which
will then select all your search results.
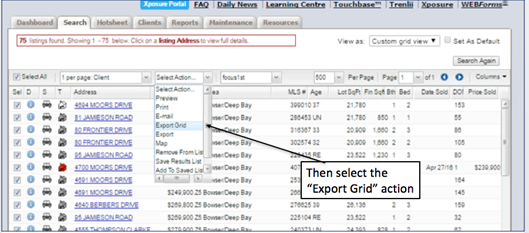
Once
you have all your search results selected you are ready to export your
data. To export your data, use the
“Select Action” drop down arrow and select the “Export Grid” option as shown
below.
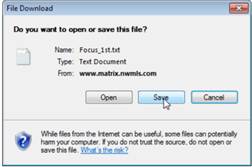
The
download will now start. Once the
download starts, you may be asked if you want to save the file. Select the save option and then choose a file
name.
Be sure
to remember where you save your file.
This is the exported file that will be used to create your graphs.
You
will see dialog boxes similar to what you see below.
Once
you have saved your exported file, you are ready to run the application.
When
you run the application you will need to point to the
exported data file, so make sure that you’ve placed the file in an easy to find
place.
For
instructions on how to run the application, be sure to see the tutorials located at http://www.focus1st.com.