Exporting
Data from CAN, AB,
Canmore – Interface Express
In
selecting data from Interface Express, be sure to select the options below:
·
You
should also make your normal selection choice by selecting other options that
you would normally select in doing a CMA.
As mentioned earlier, looking at activity in specific subdivisions
(location) is a good starting point.
·
Make
sure that all the status options are selected.
This option will make sure that all the data that is needed to create
the appropriate graphs, is collected.
·
It
is also recommended that you include data from the last two year to enable you
to see the recent patterns.
Once
you’ve selected the search criteria, press the ‘Search’
button to see the results as shown below.
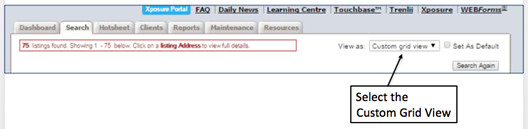
Now you are ready to download the results. To download the results, first select the
“Custom Grid View” using the drop down arrow in the “View As” option as shown
below.
Once
you select the “Custom Grid View” you will see the interface changes.
Next
you will need to setup a custom grid format that include all the fields needed
by the Visual Pricing System. This is a
one-time action that you will need to do.
Once you do this (and name the changes as you will see below), you will
not need to do this again. To setup the custom grid format, use the dropdown
arrow in the “Columns” area located at the right side of the headers.
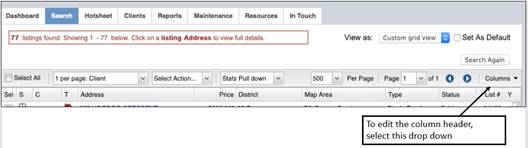
Once
you’ve selected the “Columns” drop down, select the edit column feature. This will allow to you adjust the columns
that are shown in the grid. Do this to
make sure that you include the following columns:
·
C
·
Address
·
Price
·
District
·
Map
Area
·
Type
·
Status
·
List#
·
YrBlt
·
BR
·
Bth
·
Price
Sold
·
Date
Sold
·
Date
Uncon
·
DOM
·
Date
Listed
·
SqFt
Abv Grd
·
Date
Chnged
·
Lot
SqFt
·
Price
Orig
·
Style
Once
you’ve edited the columns to include those identified above, we recommend that
you save the “columns” under the grid forma name “Focus1st”. This will allow you to easily export future
results without having to edit the columns in the future. In the future you will not need to edit the
columns, you will just need to select the custom grid format that you just
created and named “Focus1st”. You can
select the grid format as shown below by using the drop down located in the
middle of the screen near the top of the headers.
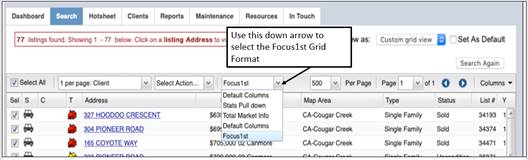
Once
you’ve selected the “Focus1st” custom grid format that you created, you will
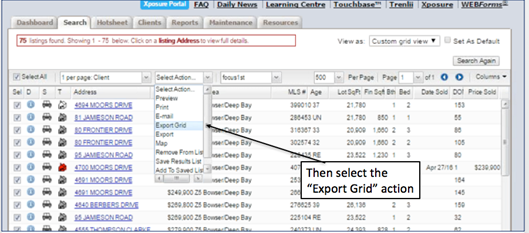
want to be sure that all your search results have been selected. To do so select the “Select All” box which
will then select all your search results.
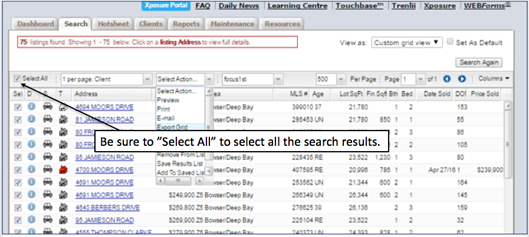
Once
you have all your search results selected you are ready to export your
data. To export your data, use the
“Select Action” drop down arrow and select the “Export Grid” format as shown
below.
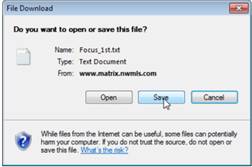
The
download will now start. Once the
download starts, you will be asked if you want to save the file. Select the save option and then choose a file
name.
Be sure
to remember where you save your file.
This is the exported file that will be used to create your graphs.
You
will see dialog boxes similar to what you see below.
Once
you have saved your exported file, you are ready to run the application.
When
you run the application you will need to point to the exported data file, so
make sure that you’ve placed the file in an easy to find place.
For
instructions on how to run the application, be sure to see the tutorials located at http://www.focus1st.com.