Exporting Data from AL,
Tuscaloosa - SolidEarth
Using the Report Designer to setup the Export Format
Before
you can export data, you must first setup the Export format. This is a one time action that you will need
to do. The format must be setup exactly as
shown in this section for the Buying Pattern application to understand the
format.
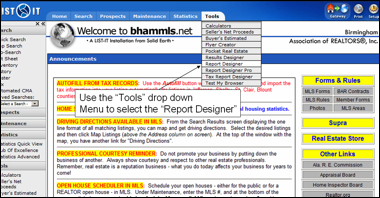
Under
the “Tools” menu, select the “Report Designer” option. Once you’ve pressed the “Report Designer”
option, you will see a dialog box as shown below.
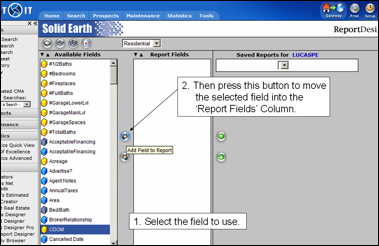
To
define the fields in your report, select a field from the left table (shown as
“Available Fields” and press the ![]() key.
You will see the item move to the table on the right (shown as “Report
Fields”).
key.
You will see the item move to the table on the right (shown as “Report
Fields”).
Do
this for each of the options as shown below.
Be sure that you
create the spreadsheet with the fields that are shown below (additional fields
will be ignored).
·
#
Bedrooms
·
#
of Total Baths
·
Approx
SqFt
·
City
·
Date:
Listing
·
Date:
Sold
·
Date:
Status
·
List
Price
·
MLS
Number
·
Sold
Price
·
Status
·
Street
Name
·
Street
Number
·
Style
·
Subdivision
·
Unit
Number
·
Year
Built
Your
screen should look similar to that shown below.
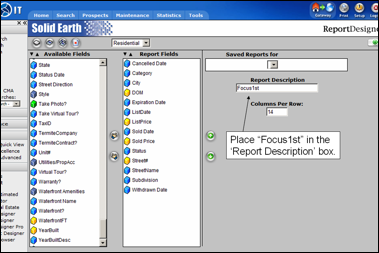
Next
place the name “Focus1st” as the “Report Description” as shown above.
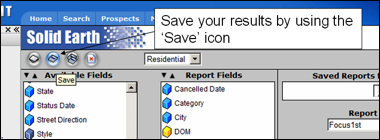
Once
you have completed the task above, save the results by pressing the ![]() icon.
You are now ready to do your MLS search and export results.
icon.
You are now ready to do your MLS search and export results.
Tuscaloosa
In
selecting data from your MLS, be sure to select the options below:
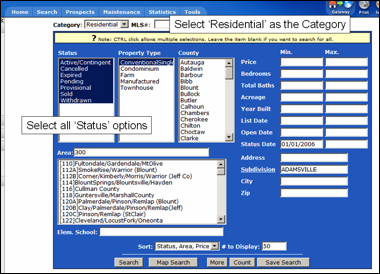
First
select “Residential” as the category.
Then make sure that all the status options are selected. This option will make sure that all the data
that is needed to create the appropriate graphs, is collected.
You
should also make your normal selection choice by selecting other options that
you would normally select in doing a CMA.
As mentioned earlier, looking at activity in specific subdivisions is a
good starting point. (In this example we
are looking at activity in the “Adamsville’ Subdivision. )
To
avoid downloading unnecessary data, you may select only sold, withdrawn, and
expired data within the last 24 months.
To do this set the ‘Status Date’ to start at ‘01/01’2006’ (assumes it is
2008, you are only looking for the last two years of data).
Once
you’ve selected the search criteria, press the ![]() button to see the results as shown below. Now you are ready to download the
results.
button to see the results as shown below. Now you are ready to download the
results.
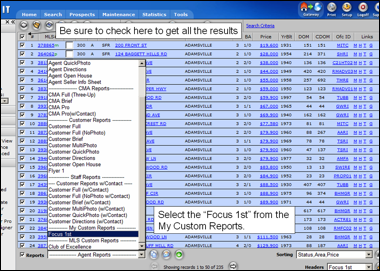
Check
the box in the header area to make sure that all the records are exported
(otherwise only the first 50 records shown will be exported).
Then
check the “Report” box at the bottom of the page and select the “Focus 1stf”
from the ‘Custom Report’ heading (as shown in the graphic above).
To
download the results, select the ![]() button (located at the bottom of the
page). When you select the download
button, the screen shown below is displayed.
button (located at the bottom of the
page). When you select the download
button, the screen shown below is displayed.
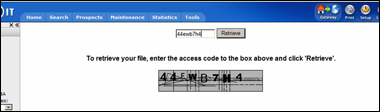
Enter
the access code shown in the box and click the ![]() button.
You will then see a screen similar to that shown below.
button.
You will then see a screen similar to that shown below.
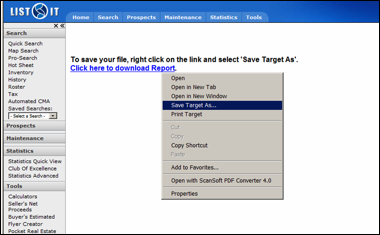
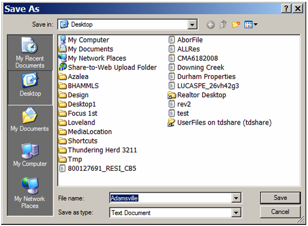
Right
click on the Click
here to download Report
link and use the “Save Target As…” to save and choose a file name.
Be sure
to remember where you save your file.
This is the exported file that will be used to create your graphs.
You
will see dialog boxes similar to what you see below.
Once
you have saved your exported file, you are ready to run the Focus 1st
application.
When
you run the application you will need to point to the exported data file, so
make sure that you’ve placed the file in an easy to find location.
For
instructions on how to run the Visual Pricing System see the on-line tutorials
located at www.focus1st.com .