Exporting
Data from FL, SWFLMLS
- Matrix
Using the “Custom
Export” to setup the Export Format
Before
you can export data, you must first setup the Export format. This is a one time action that you will need
to do. The format must be setup exactly as
shown in this section for the Buying Pattern application to understand the
format. To create your export format,
select the following menu items: My Matrix->Settings->Custom Exports.
Press
the “Add Export” button to create your Export Format. You will see a screen similar to that shown
below.
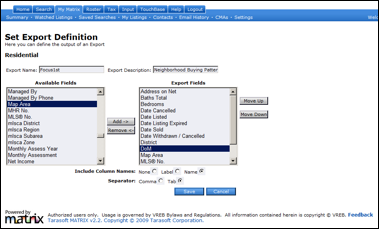
First
place the name “Focus 1st” as the “Export Name as shown above. Then you will need to define the fields to be
in the new Export format (also referred to as Export Definition). To define the fields, select a field from the
left table (shown as “Available Items” and press the ![]() key.
You will see the item move to the table on the right.
key.
You will see the item move to the table on the right.
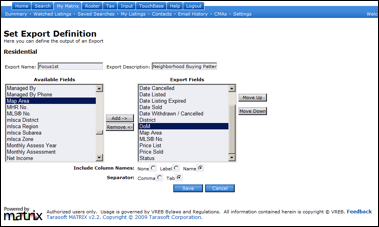
Do
this for each of the options as shown in the list below.
Be
sure to add the fields shown below:
·
Approx
Living Area
·
Baths
Total
·
Beds
Total
·
City
·
DOM
·
Floor
Plan Type
·
Full
Address
·
List
Price
·
Listing
Date
·
MLS
Number
·
Sold
Date
·
Sold
Price
·
Status
·
Status
Change Timestamp
·
Subdivision
Number
·
Total
Area
·
Year
Built
Additionally,
make sure to select under the “Include Column Names:” option the “Name” option
button, and make sure to select under the “Separator:” option the “Tab” button
as shown below.
![]()
Once you
have completed the task above, save the results by pressing the ![]() button.
You are now ready to do your MLS search and export results.
button.
You are now ready to do your MLS search and export results.
FL, SWFLMLS - Matrix
In
selecting data from Matrix, be sure to select the option below:
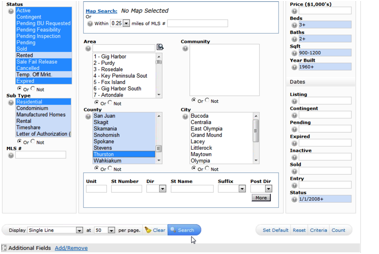
Make
sure that all the status options are selected.
This option will make sure that all the data that is needed to create
the appropriate graphs, is collected.
You
should also make your normal selection choice by selecting other options that
you would normally select in doing a CMA.
As mentioned earlier, looking at activity in specific subdivisions is a
good starting point.
It is
also recommended that you include data from the last two year to enable you to
see the recent patterns. In this example
(the search is run in early 2010), we've included all items with a status data
of "1/1/2010+".
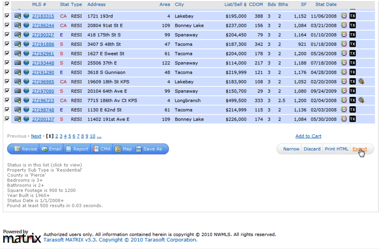
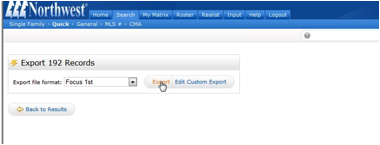
Once
you’ve selected the search criteria, press the ‘Search’
button to see the results as shown below.
Now you are ready to download the results. To download the results, select the ‘Export’ button (as shown below.
Note: The first time you use the export
functionality you may not see the export button as described above. However, on the lower right side of the
screen you will see an arrow pointer.
Pressing that button will show the export button. You may also need to make sure that you have
selected data. To do so, be sure the use
the “Check all” option at the top of the screen. This will select all the data and not just
the data on the screen.
Next
you will see the screen shown below.
Select the “Focus 1st” Export Grid Format (by using the drop
down box). Then press the ‘Export’ button.
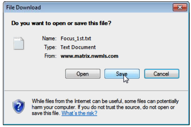
The
download will now start. Once the
download starts, you will be asked if you want to save the file. Select the save option and then choose a file
name.
Be sure
to remember where you save your file.
This is the exported file that will be used to create your graphs.
You
will see dialog boxes similar to what you see below.
Once
you have saved your exported file, you are ready to run the application.
When
you run the application you will need to point to the exported data file, so
make sure that you’ve placed the file in an easy to find place.
For
instructions on how to run the application, be sure to see the tutorials located at http://www.focus1st.com.