Exporting
Data from CAN,
BC, Vancouver Island
Using the process to export data from the Vancouver Island MLS will require some knowledge and minimal expertise in using both the Microsoft Windows ‘cut’ and ‘paste’ functions and Microsoft Excel. You will need to select data from the Windows based MLS interface and copy the contents into Excel. You will then need to save out the results in a ‘comma delimited’ file. The instructions below will walk you through that process.
In selecting data from Vancouver Island, first select data that matches your “customer profile”. In many cases, this will be as easy as selecting all the data in the subject property’s neighborhood. However, you are not limited to that. You can make any selection you’d like based a matching the customer profile.
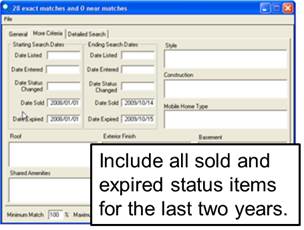
In addition, to the selection above, be sure to select the all status activities for the last two years as shown below:
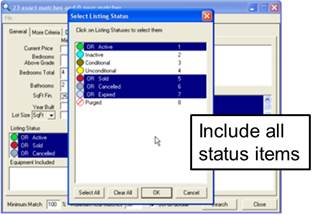
Make sure that all the status options are selected. Selecting all the data for the last two years, will allow you to see patterns and trends more effectively. These options will make sure that all the data that is needed to create the appropriate graphs, is collected.
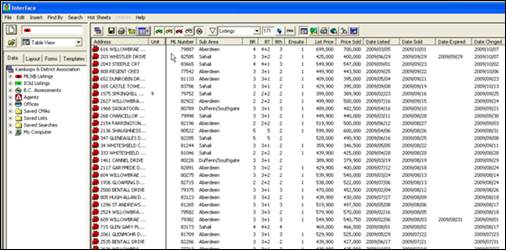
Once you’ve selected your options, completed your search and are showing your results, you screen will look comparable to that shown below.
You are now ready to create an export file with your results.
Before exporting results, you will need to make sure that you are including all the data that is needed. To make sure that you are collecting all the data, be sure that you have included the following headers:
Address
BR
Bth
Date Chnged
Date Listed
Date Sold
DOM
List Price
ML Number
Price Sold
SqFt Fin
SqFt Total
Status
Style
Sub Area
Unit
Yr Blt
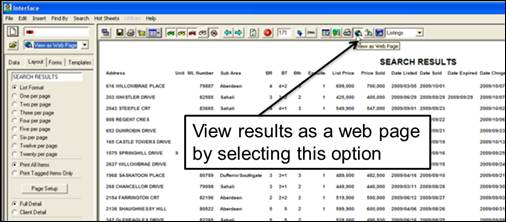
To create your export file you will need to copy the results from the “Interface” program and paste them into excel. The first step is to change the view to the “web page” view. Select the “view as a web page” option to view your results as a web page. The diagram below shows the location of the “view as a web page” option.
Once you are viewing the page as a web page, you will want to select all the data shown on the page. You can select all the data either by using the ‘Edit’ menu and selecting the “select all” option, or by placing your cursor in the web page and holding down the <control> key and pressing the <A> key. Once you select all the data, you will see it highlighted as shown below.
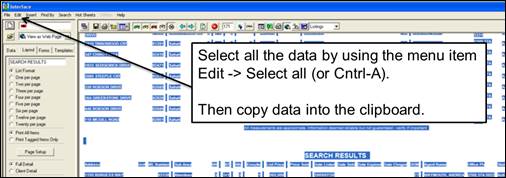
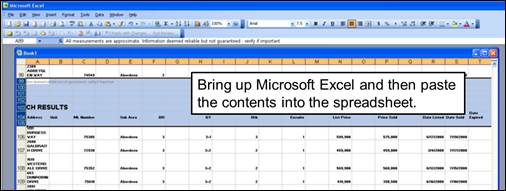
After you’ve selected all the data, you will need to copy that data. You can copy the data either by using the ‘Edit’ menu and selecting the “copy” option, or by holding down the <control> key and pressing the <C> key. Once you’ve copied the data, you will need to paste it into Microsoft Excel. Open Microsoft Excel and select the first cell in the spreadsheet. The ‘paste’ the results of the copy you just did. You can paste the data either by using the ‘Edit’ menu and selecting the “paste” option, or by holding down the <control> key and pressing the <V> key. Once you have pasted the results, you will see your results in Microsoft Excel as shown below.
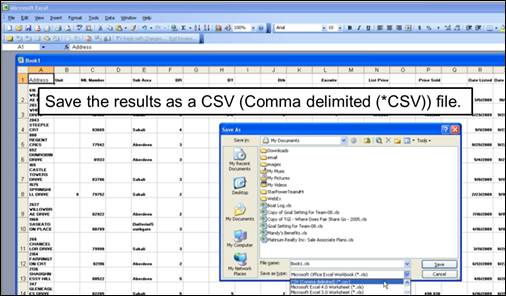
Once, you’ve pasted the data into Excel, you are ready to save the file out as a CSV file. To save out the file, select the SAVE AS option. In the Save As, option select the “CSV (Comma delimited (*CSV)) file option. Choose a name the represents the search you did to help you to remember the contents.
Once you have saved your exported file, you are ready to run the application.
When you run the application you will need to point to the exported data file, so make sure that you’ve placed the file in an easy to find place.
For instructions on how to run the Visual Pricing application, go to http://www.focus1st.com and see the tutorial section.